

Review
doi: 10.1534/genetics.108.090878.
Aneuploidy: cells losing their balance
Affiliations
- PMID: 18558649
- PMCID: PMC2429870
- DOI: 10.1534/genetics.108.090878
Item in Clipboard
Review
Aneuploidy: cells losing their balance
Genetics.
2008 Jun.
Abstract
A change in chromosome number that is not the exact multiple of the haploid karyotype is known as aneuploidy. This condition interferes with growth and development of an organism and is a common characteristic of solid tumors. Here, we review the history of studies on aneuploidy and summarize some of its major characteristics. We will then discuss the molecular basis for the defects caused by aneuploidy and end with speculations as to whether and how aneuploidy, despite its deleterious effects on organismal and cellular fitness, contributes to tumorigenesis.
Figures
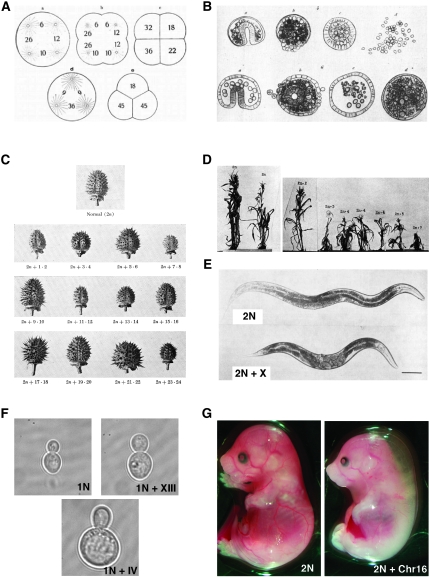
Aneuploidy interferes with growth and development. (A) Schematics by Theodor Boveri of the first division of doubly fertilized sea urchin embryos that form four (top) or three centrosomes (bottom) during the first embryonic mitosis. The figure was reproduced from Figure 2.12-5 in Cremer (1985). (B) Drawings by Boveri showing abnormally developing dispermic sea urchin embryos. These embryos were obtained from dispermic fertilizations that were subsequently dissociated at the four-celled stage using calcium-free seawater. Each of the dissociated cells then develops into a larva. Each row represents larvae from one dissociated embryo. The first embryos at the left (top and bottom) represent relatively normal larvae, and the other larvae show varying degrees of developmental abnormalities. This drawing was reproduced from Figure 2.12-6 in Cremer (1985). (C) Drawing of the capsules of diploid D. stramonium (top) and the 12 autosomal 2n + 1 trisomies. Datura has 12 pairs of chromosomes that are referred to with numbers associated with their ends. The largest chromosome is 1·2, the next largest is 3·4, and so on. The drawings were obtained from Avery (1959). (D) Photographs of diploid maize (left) and seven 2n + 1 trisomic plants. The maize genome consists of 10 chromosomes where chromosome 1 is the smallest and 10 is the largest. The images were reproduced from Mc Clintock (1929). (E) Photographs of an adult diploid worm (2n; top) and a worm trisomic for the X chromosome (2n + X; bottom). The images were reproduced from Hodgkin et al. (1979). (F) Haploid S. cerevisiae that is euploid (top left) and carries an extra copy of chromosome XIII (top right) or an extra copy of chromosome IV (bottom). (G) Mouse embryos that are euploid (left) or trisomic for chromosome 16 (right) at day 14.5 of development. Trisomic mouse is reduced in size and displays nucal edemas.
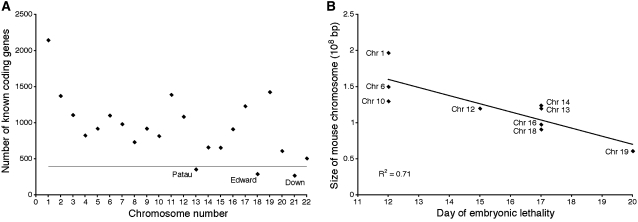
A correlation between degree of aneuploidy and organismal fitness in humans and mice. (A) The number of known human transcripts/chromosome in humans. Trisomies below the line develop to birth. Trisomies above the line are embryonic lethal. Only those chromosomes containing the least amount of transcripts survive birth. (B) In mice, survival of the embryo is inversely correlated with the size of the chromosome that is present in three copies. Linear regression analysis fits the data with an R2 of 0.71.
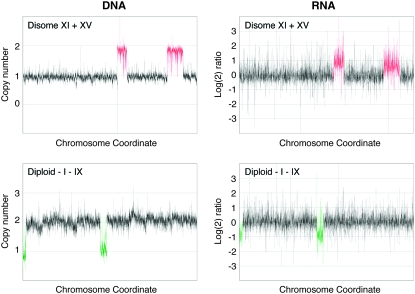
Changes in RNA expression correlate with changes in DNA copy number in aneuploid S. cerevisiae. Each box represents the genome of an aneuploid yeast strain, with data points from the microarray analysis ordered according to their chromosomal coordinates. The left end of the left arm of chromosome I is shown at the left end of the graph, and the right end of the right arm of chromosome XVI is on the right end. DNA copy number and the log2 ratio of changes in gene expression of haploid yeast cells disomic for chromosomes XI and XV (top) and diploid cells mosomic for chromosome I and IX (bottom) are shown as normalized to the wild type. Data are courtesy of E. Torres and M. Dunham.
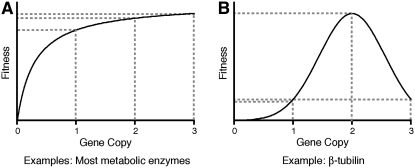
Two of the simplest possible effects of changes in gene copy number on organismal fitness. (A) Changes in copy number of genes that encode for enzymes should follow the Kacser and Burns hypothesis. That is, the effects on fitness are dictated by the activity of the enzymatic pathway rather than by the enzyme concentration. On the other hand (B), changes in copy number of structural genes such β-tubulin have much more deleterious effect on fitness.
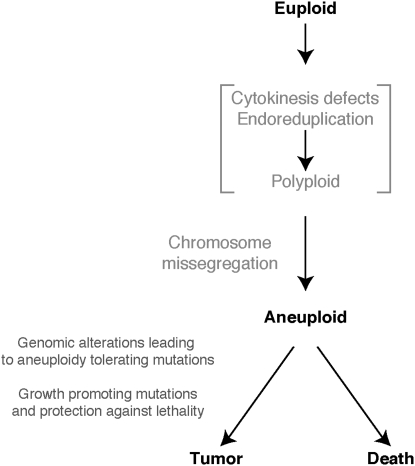
A model for how aneuploidy could promote tumorigenesis. See text for details.
References
-
- Adams, K. L., and J. F. Wendel, 2005. Polyploidy and genome evolution in plants. Curr. Opin. Plant Biol. 8 135–141. - PubMed
-
- Albertson, D. G., C. Collins, F. McCormick and J. W. Gray, 2003. Chromosome aberrations in solid tumors. Nat. Genet. 34 369–376. - PubMed
-
- Avery, A. G., 1959. Blakeslee: The Genus Datura. Ronald Press, New York.
-
- Blakeslee, A. F., J. Belling and M. E. Farnham, 1920. Chromosomal duplication and Mendelian phenomena in Datura mutants. Science 52 388–390. - PubMed
Publication types
MeSH terms
Grants and funding
LinkOut - more resources
Full Text Sources
Other Literature Sources
