. 2008 Jul 15;47(28):7465-76.
doi: 10.1021/bi800393u. Epub 2008 Jun 18.

Quantification of ligand-regulated nuclear receptor corepressor and coactivator binding, key interactions determining ligand potency and efficacy for the thyroid hormone receptor

Affiliations

Quantification of ligand-regulated nuclear receptor corepressor and coactivator binding, key interactions determining ligand potency and efficacy for the thyroid hormone receptor

M Jeyakumar et al. Biochemistry. .

Abstract

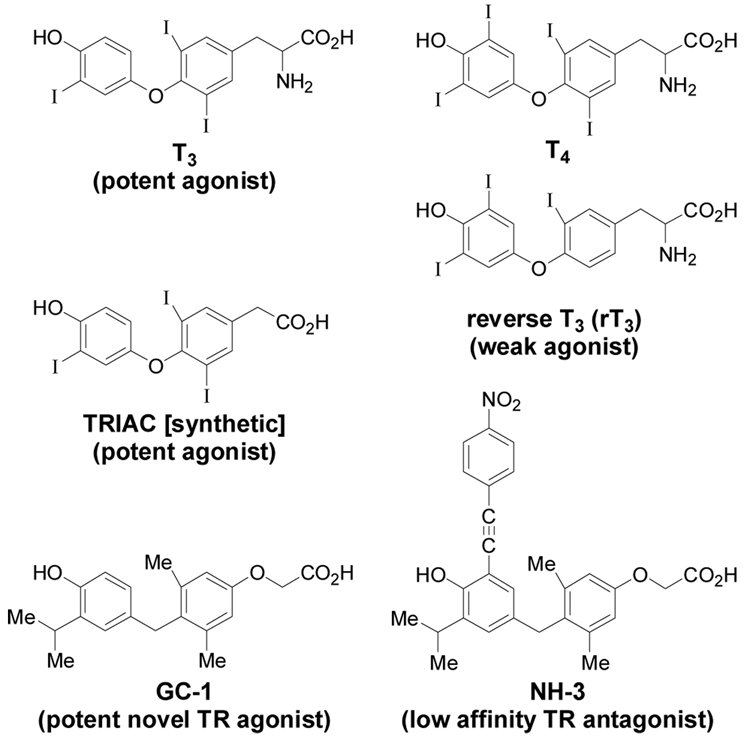
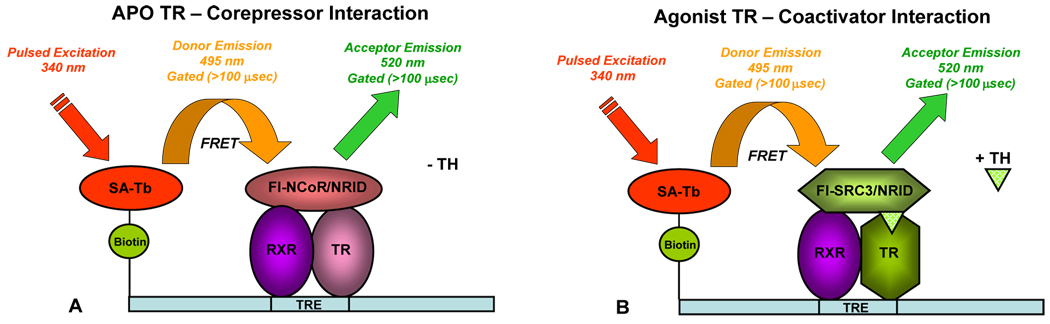
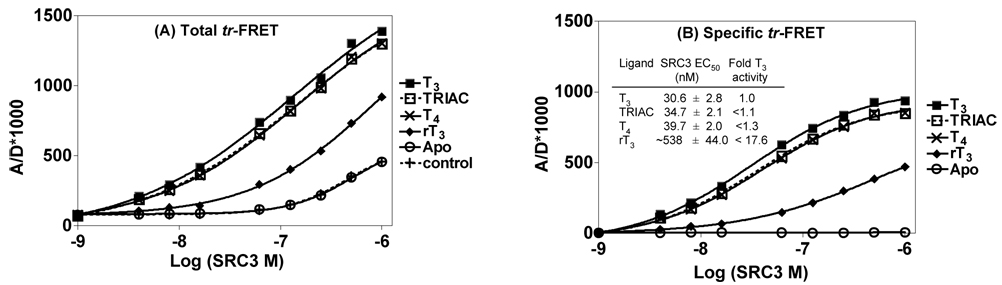
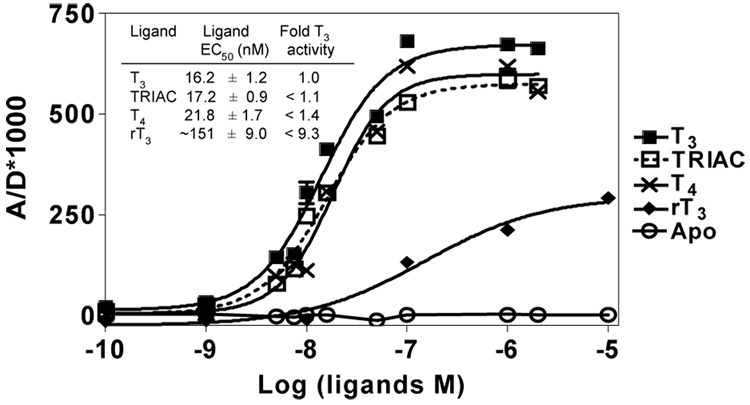
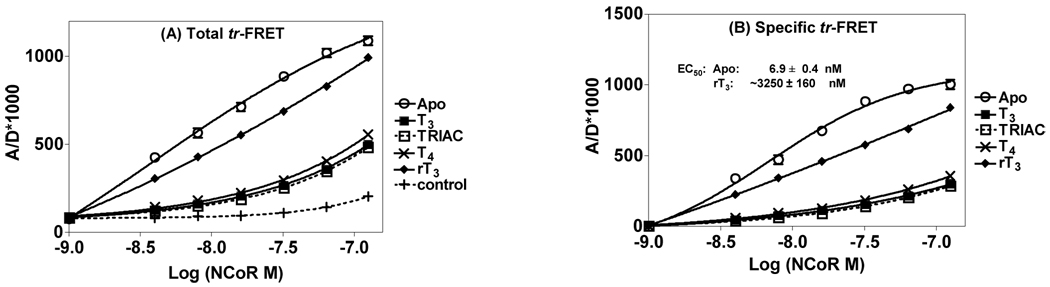
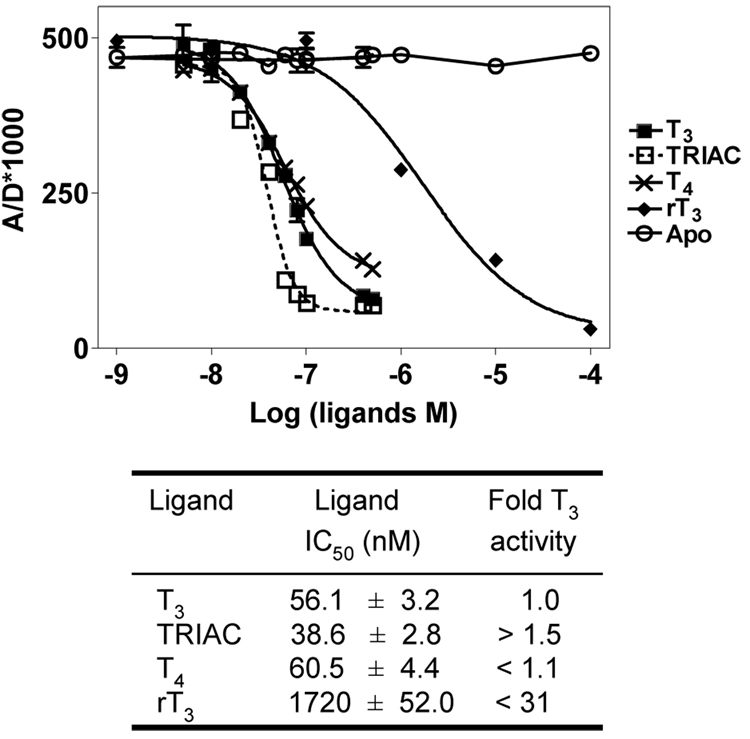
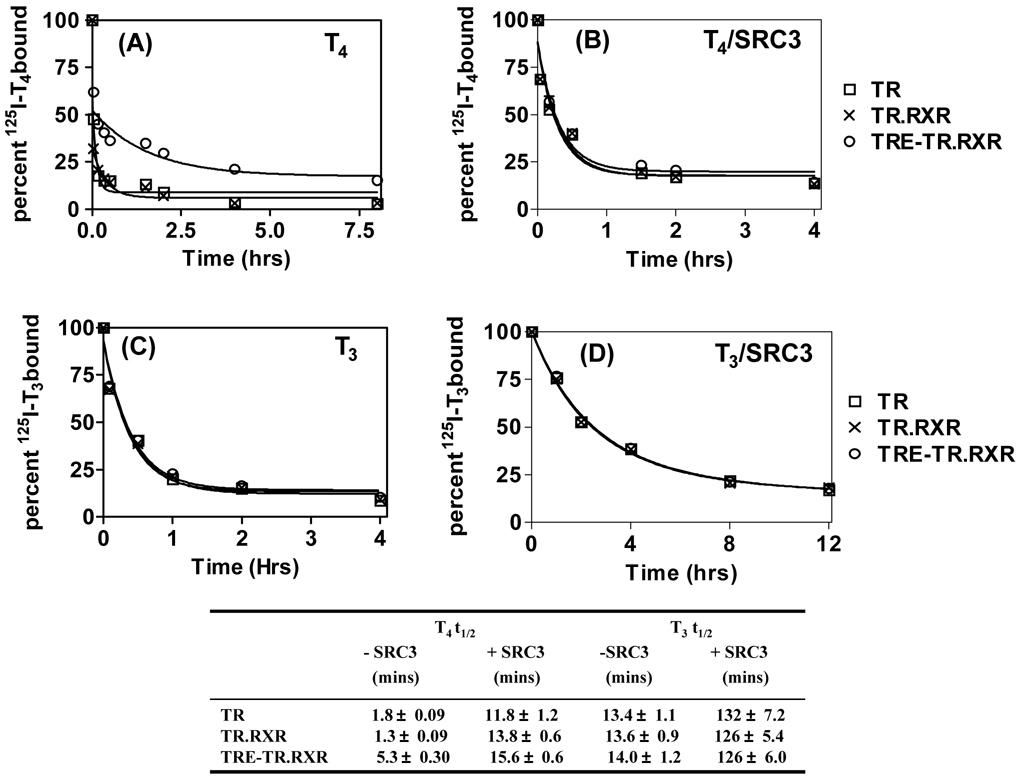
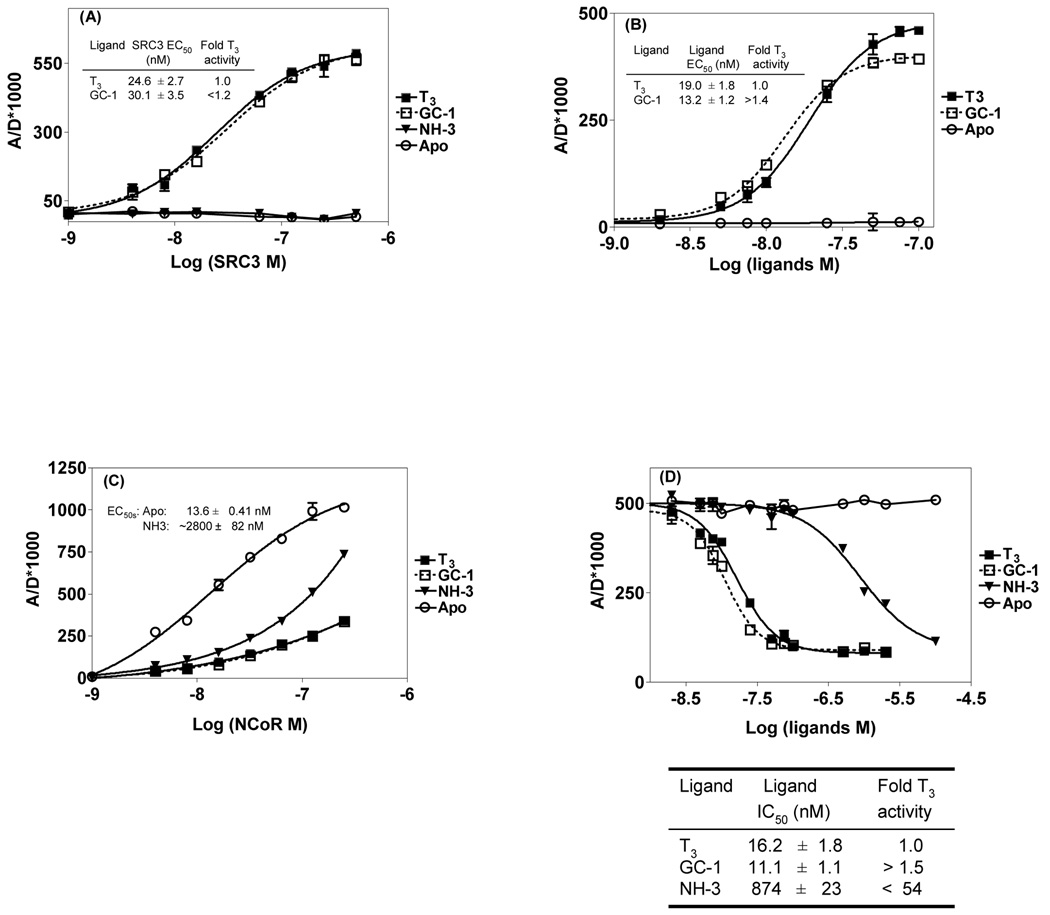
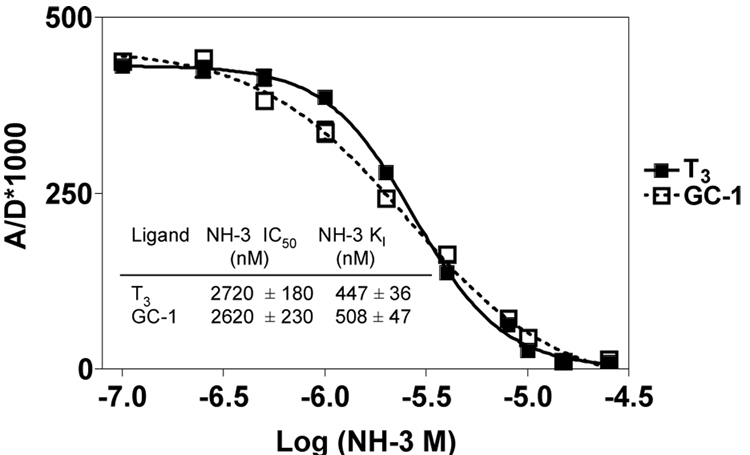
The potency and efficacy of ligands for nuclear receptors (NR) result both from the affinity of the ligand for the receptor and from the affinity that various coregulatory proteins have for ligand-receptor complexes; the latter interaction, however, is rarely quantified. To understand the molecular basis for ligand potency and efficacy, we developed dual time-resolved fluorescence resonance energy transfer (tr-FRET) assays and quantified binding of both ligand and coactivator or corepressor to the thyroid hormone receptor (TR). Promoter-bound TR exerts dual transcriptional regulatory functions, recruiting corepressor proteins and repressing transcription in the absence of thyroid hormones (THs) and shedding corepressors in favor of coactivators upon binding agonists, activating transcription. Our tr-FRET assays involve a TRE sequence labeled with terbium (fluorescence donor), TRbeta.RXRalpha heterodimer, and fluorescein-labeled NR interaction domains of coactivator SRC3 or corepressor NCoR (fluorescence acceptors). Through coregulator titrations, we could determine the affinity of SRC3 or NCoR for TRE-bound TR.RXR heterodimers, unliganded or saturated with different THs. Alternatively, through ligand titrations, we could determine the relative potencies of different THs. The order of TR agonist potencies is as follows: GC-1 approximately T 3 approximately TRIAC approximately T 4 >> rT 3 (for both coactivator recruitment and corepressor dissociation); the affinities of SRC3 binding to TR-ligand complexes followed a similar trend. This highlights the fact that the low activity of rT 3 is derived both from its low affinity for TR and from the low affinity of SRC for the TR-rT 3 complex. The TR antagonist NH-3 failed to induce SRC3 recruitment but did effect NCoR dissociation. These assays provide quantitative information about the affinity of two key interactions that are determinants of NR ligand potency and efficacy.


Figures

FIGURE 1
FIGURE 1
The structures of the different ligands used: endogenous thyroid hormones, T3, T4 and rT3, and synthetic TRβ-selective agonists, TRIAC and GC-1, and antagonist, NH-3.
FIGURE 2
FIGURE 2. Principle of the dual tr-FRET assays
A, NCoR interacts with unliganded TR•RXR heterodimer bound to a TRE. hTRβ (residues 82–456)•hRXRα (full length) heterodimer was assembled onto a terbium-labeled streptavidin-bound biotinylated DR+4 sequence (49 bp derived from the rat myosin heavy chain promoter) and incubated with the fluorescein labeled-NRID fragment of mNCoR (residues 2057–2453). The terbium (donor) was excited at 340 nm, and tr-FRET was measured after 100-µsec delay at 495 nm for terbium (donor) and 520 nm for fluorescein (acceptor). B, SRC3 interacts with liganded TR•RXR heterodimer bound to a TRE. The assay format is essentially the same as that described for Fig. 2A, except that fluorescein-labeled NRID fragment of hSRC3 (residues 627–829) recruitment to TRE-bound TR•RXR was measured in the presence of different TR ligands.
FIGURE 3
FIGURE 3. Ligands specify affinity of SRC3 to TRE-bound TR•RXR heterodimers (coactivator titration)
A, A fixed amount of TR•RXR heterodimer (15 nM) bound to a biotinylated TRE was incubated with increasing concentrations of fluorescein-labeled SRC3 (NRID fragment) in the absence (Apo) and presence of 3 µM of T3, TRIAC, T4 and rT3, as described under “Experimental Procedure”. Control assays containing all the components minus the biotinylated DNA were used to correct for diffusion-enhanced FRET. After incubation at room temperature for 1 h, tr-FRET was measured and plotted as the ratio of acceptor to donor × 1000 (A/D*1000) against log of fluorescein-labeled SRC3 concentration. The binding curves obtained for different ligands and the control are shown. B, The tr-FRET values presented in each of the binding curves in Fig. 3A were subtracted from the corresponding diffusion-enhanced FRET values, and the resulting specific FRET units are plotted against the log SRC3 concentrations. Three independent sets of experiments were performed in replicate, and each assay point in the binding curves represents mean ± SD of six measurements. Data in Fig. 3B were analyzed by non-linear regression with an equation for sigmoidal dose response (variable slope) in GraphPad Prism, and the concentrations of fluorescein-labeled SRC3 at 50% (EC50) of maximal binding in the presence of indicated TR ligands were obtained and listed in the table as mean EC50 ± SD of three different experiments. Fold T3 activity was calculated as a ratio of respective ligand EC50 value to that of T3. The Z’ factor was calculated by using the six replicates of maximally responsive specific tr-FRET values obtained with each ligand and the corresponding value obtained in the absence of ligand (Apo) as described in the Experimental Procedure section. The Z’ factor for SRC3 recruitment by each ligand ranged 0.80–0.84.
FIGURE 4
FIGURE 4. Measurement of ligand potency for SRC3 recruitment to TRE-bound TR•RXR heterodimers (ligand titration)
Increasing amounts of different TR ligands were tested for their ability to recruit a submaximal concentration of fluorescein-labeled SRC3 (125 nM) to a fixed amount of TRE-bound TR•RXR (15 nM). tr-FRET values obtained in the presence of each ligand were subtracted from the respective diffusion-enhanced control FRET values and plotted against the log of ligand concentration. Apo represents the SRC3 binding pattern to the vehicle-treated TR•RXR (unliganded). Each point in the binding curves represents mean ± SD of six measurements from three different experiments performed in replicate. Data were analyzed as described in the legend to Fig. 3B, and the ligand concentration to induce 50% of maximal SRC3 recruitment was determined and listed in the table as mean EC50 ± SD of three independent experiments. Fold T3 activity was calculated as described in the previous experiment. The Z’ factor for T3, TRIAC, T4 and rT3 induced SRC3 recruitment was in the range of 0.76–0.82.
FIGURE 5
FIGURE 5. Ligand specify affinity of NCoR to TRE-bound TR•RXR heterodimers (corepressor titration)
A, Serially diluted fluorescein-labeled NCoR was incubated with a fixed amount of DNA-bound TR•RXR (15 nM) in the presence and absence (Apo) of the indicated TR ligands (3 µM each), and the resulting tr-FRET signal was measured as described under “Experimental Procedure”. B, Binding curves represent results in Fig. 5A after correction for diffusion-enhanced tr-FRET. The EC50 ± SD of NCoR recruitment to unliganded TR•RXR from three experiments is shown. In this assay NCoR recruitment for un-liganded TR (Apo) had a Z’ factor of 0.74.
FIGURE 6
FIGURE 6. Measurement of ligand potency for NCoR dissociation from TRE-bound TR•RXR heterodimers (ligand titration)
A submaximal concentration of fluorescein-NCoR (24 nM) was incubated with a fixed amount of TR•RXR (15 nM) bound to a TRE in the presence and absence (Apo) of indicated concentrations of different TR ligands. The tr-FRET values corrected for diffusion-enhanced tr-FRET values for each of the ligands are shown. Three sets of experiments in replicate were performed, and each point in the curves represents mean ± SD of six measurements. Data in Fig. 6 were analyzed by non-linear regression with an equation for sigmoidal dose response (variable slope) in GraphPad Prism, and the concentrations of each of the TR ligands to effect 50% dissociation (IC50s) of maximal NCoR binding were obtained and listed in the table as mean IC50 ± SD of three different experiments. Fold T3 activity was calculated as a ratio of respective ligand value IC50 to that of T3. NCoR remained maximally bound to the corresponding unliganded (solvent-treated) TR•RXR sample wells (Apo). The Z’ factor for each ligand induced NCoR disociation was measured to be 0.73–0.85.
FIGURE 7
FIGURE 7. Ligand dissociation assays
TR alone or in a complex with RXR or RXR plus DR+4 TRE (3. nM each) was incubated with 25 nM 125I-T4 (Fig. 7A) or 125I-T3 (Fig. 7C) in the absence (total binding) and in the presence of 2.5 µM of the respective unlabeled-hormone (non-specific binding) until the reaction reached equilibrium (12 hrs at 4 °C). Experiments in Fig. 7B and Fig.7D are similar to those in Fig. 7A and Fig. 7C, respectively, but contained a saturating concentration of unlabeled SRC3 NRID fragment (100 nM). 50 µl aliquots from the reactions set for total binding were applied onto a sephadex G-25 column (2 ml) before and at the indicated times, after the addition of corresponding unlabeled hormones (2 µM), and the hormone-bound fraction was collected and counted in a γ-counter. Non specific binding was determined similarly by column fractionation and subtracted from the total binding of corresponding experiment to obtain the specific binding. The specific binding from the fraction collected before the addition of unlabeled hormone was set to 100%. Dissociation curves were generated by plotting the percent bound radioactivity vs time. Data were analyzed by non-linear regression with an equation for three phase exponential decay. The time taken for 50% dissociation (t1/2) is measured from the curve. Each point in the dissociation curves represents mean ± SD of three independent experiments, and the respective t1/2 values are provided in the accompanying table.
FIGURE 8
FIGURE 8. Evaluations of GC-1 and NH-3 in the dual coregulator interaction assays
A, T3, GC-1 and NH-3 specified affinity of SRC3 to TRE bound TR•RXR heterodimer. Serially diluted fluorescein SRC3 was incubated with DNA-bound TR•RXR (15 nM) in the absence (Apo) and presence of T3, GC-1 and NH-3 (3 µM), and the resulting tr-FRET values were measured. Binding curves after correction for diffusion-enhanced control values are shown. B, Determination of the potency of T3 and GC-1 to recruit SRC3. Different dilutions of T3 or GC-1 were incubated with TRE-TR•RXR (15 nM) and SRC3 (125 nM), and the resulting tr-FRET was measured. The specific tr-FRET values are shown. C, NCoR binding in the presence of T3, GC-1 and NH-3. TRE-bound TR•RXR was incubated with increasing amounts of fluorescein-labeled NCoR in the absence (Apo) and the presence of T3, GC-1 and NH-3 (3 µM), and resulting binding curves after correction for diffusion-enhanced FRET control are shown. D, Determination of ligand potency of T3, GC-1 and NH-3 in NCoR dissociation assay. TRE-bound TR•RXR heterodimer was incubated with fluorescein-labeled NCoR (24 nM) in the presence of the indicated levels of T3, GC-1 and NH-3. The specific tr-FRET values are shown. Data from Fig. 7A, B, C, or D was analyzed by non-linear regression with an equation for sigmoidal dose response (variable slope) in GraphPad Prism, and the respective EC50 and IC50 values listed in the corresponding tables represent the mean ± SD of three different experiments performed in replicates. The Z’ factor for all the four formats described here was determined to be in the range of 0.72–.0.84.
FIGURE 9
FIGURE 9. NH-3 blocks T3 and GC-1 induced SRC3 recruitment to TRE-bound TR•RXR heterodimer
Increasing amounts of NH-3 were tested for their ability to block fluorescein-labeled SRC3 recruitment to TR•RXR by a submaximal dose of T3 or GC-1 (30 nM). NH-3 displacement curves that were corrected for diffusion-enhanced FRET were analyzed by non-linear regression with an equation for sigmoidal dose response (variable slope) in GraphPad Prism, and the concentration of NH-3 to displace 50% of T3- or GC-1-induced SRC3 recruitment was determined (Fig. 9, Table). These IC50 values and the EC50 values from Fig. 8A (which approximate the apparent affinity of SRC3 to TRE-bound TR•RXR in the presence of T3 and GC-1) were used with the Cheng-Prusoff equation to estimate the relative affinity of NH-3 for displacement of SRC3 recruited to TR by T3 or GC-1. Cheng-Prusoff equation;KI=IC50/(1+T0/KD*) Where IC50 is the concentration of NH-3 to give 50% inhibition of T3- or GC-1-induced SRC3 recruitment (IC50 from Fig. 9 and Table); KI is dissociation constant of NH-3 that is to be determined; T0 is the concentration of SRC3 used in the experiment (125 nM); KD* is the EC50 values obtained from the SRC3 saturation binding curves in the presence of T3 and GC-1, 24.6 nM and 30.1 nM, respectively (Fig. 8A table). The determined apparent KI values are shown in Fig. 9 Table. Three independent experiments in replicates were performed, and the NH-3 IC50 values in the Fig. 9 Table represent the mean ± SD from three different experiments.

Similar articles

Cited by

References

    1. Lonard DM, O'Malley BW. Expanding functional diversity of the coactivators. Trends Biochem. Sci. 2005;30:126–132. - PubMed
    1. Privalsky ML. The role of corepressors in transcriptional regulation by nuclear hormone receptors. Annu. Rev. Physiol. 2004;66:315–360. - PubMed
    1. Yen PM, Ando S, Feng X, Liu Y, Maruvada P, Xia X. Thyroid hormone action at the cellular, genomic and target gene levels. Mol. Cell. Endocrinol. 2006;246:121–127. - PubMed
    1. Lazar MA. Thyroid hormone receptors: multiple forms, multiple possibilities. Endocr. Rev. 1993;14:184–193. - PubMed
    1. Apriletti JW, Eberhardt NL, Latham KR, Baxter JD. Affinity chromatography of thyroid hormone receptors. Biospecific elution from support matrices, characterization of the partially purified receptor. J. Biol. Chem. 1981;256:12094–12101. - PubMed

Publication types

MeSH terms