

Separating the wheat from the chaff: unbiased filtering of background tandem mass spectra improves protein identification
- PMID: 18558732
- PMCID: PMC2842913
- DOI: 10.1021/pr800140v
Separating the wheat from the chaff: unbiased filtering of background tandem mass spectra improves protein identification
Abstract
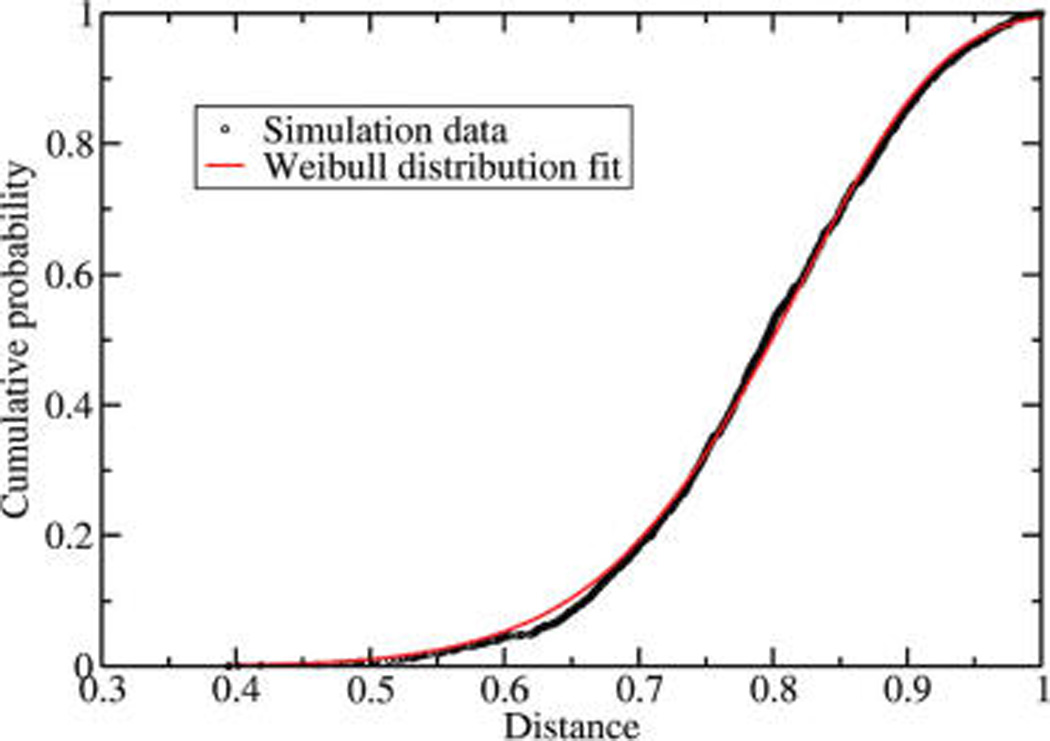
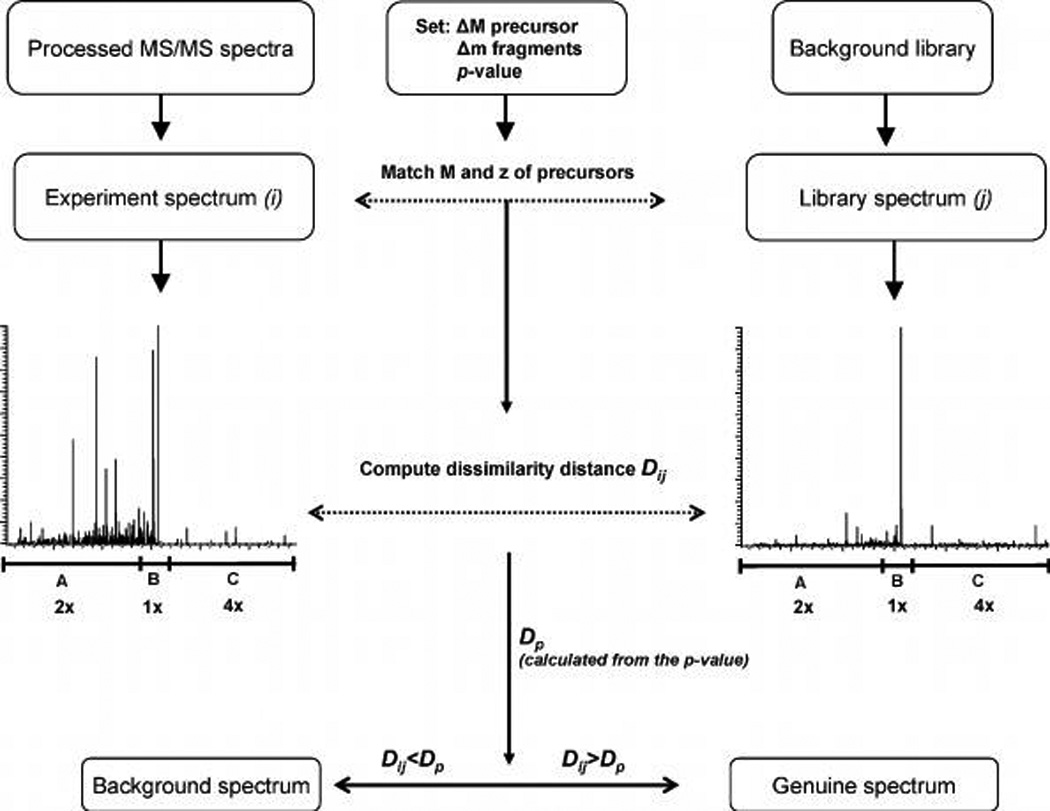
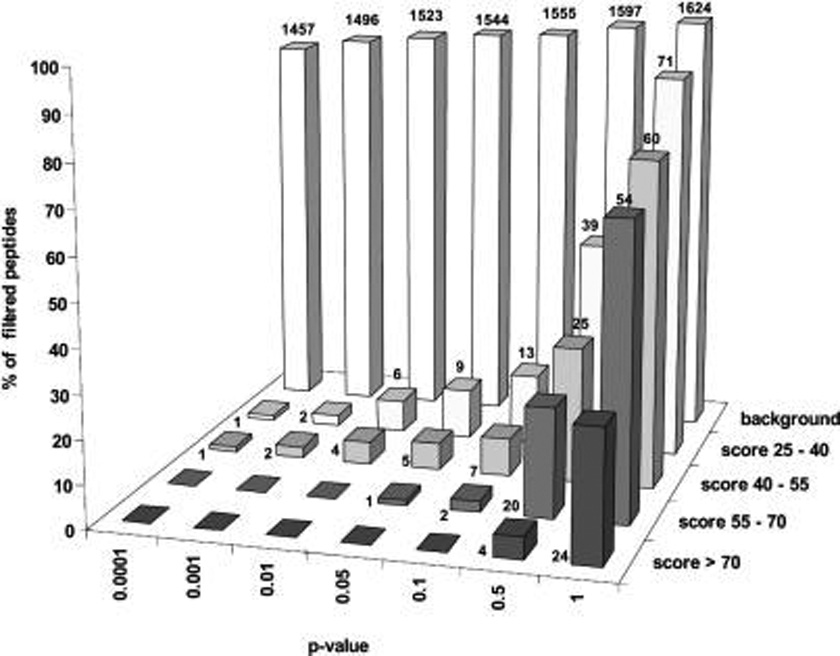
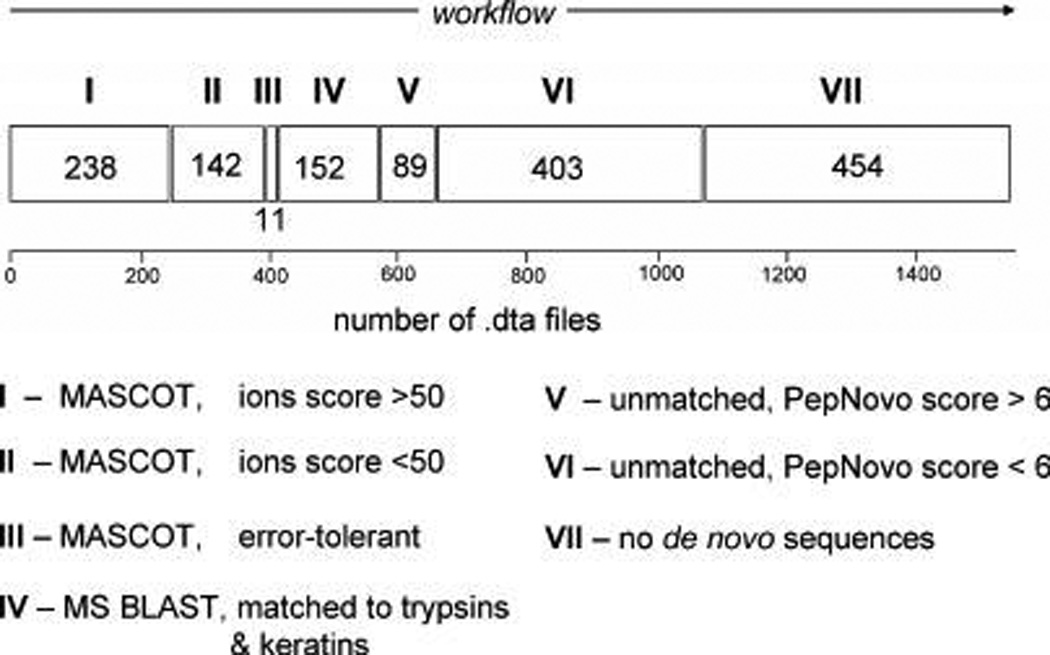
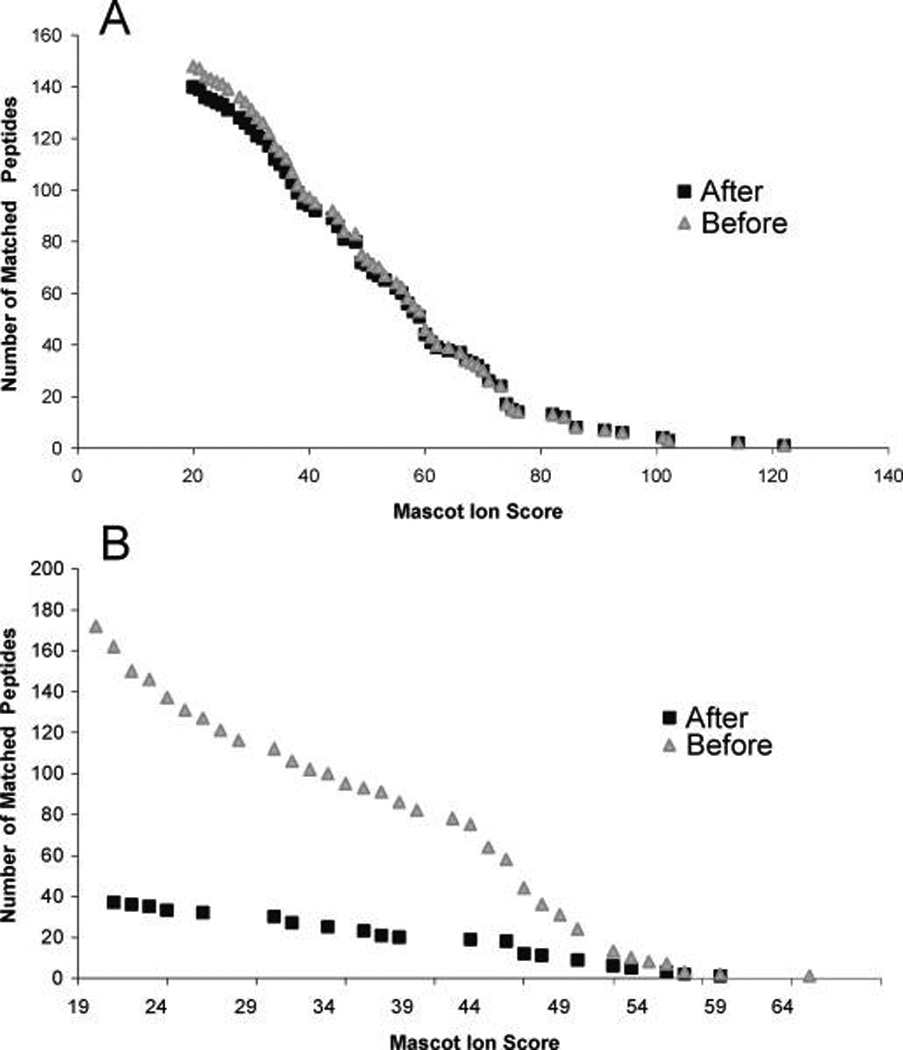
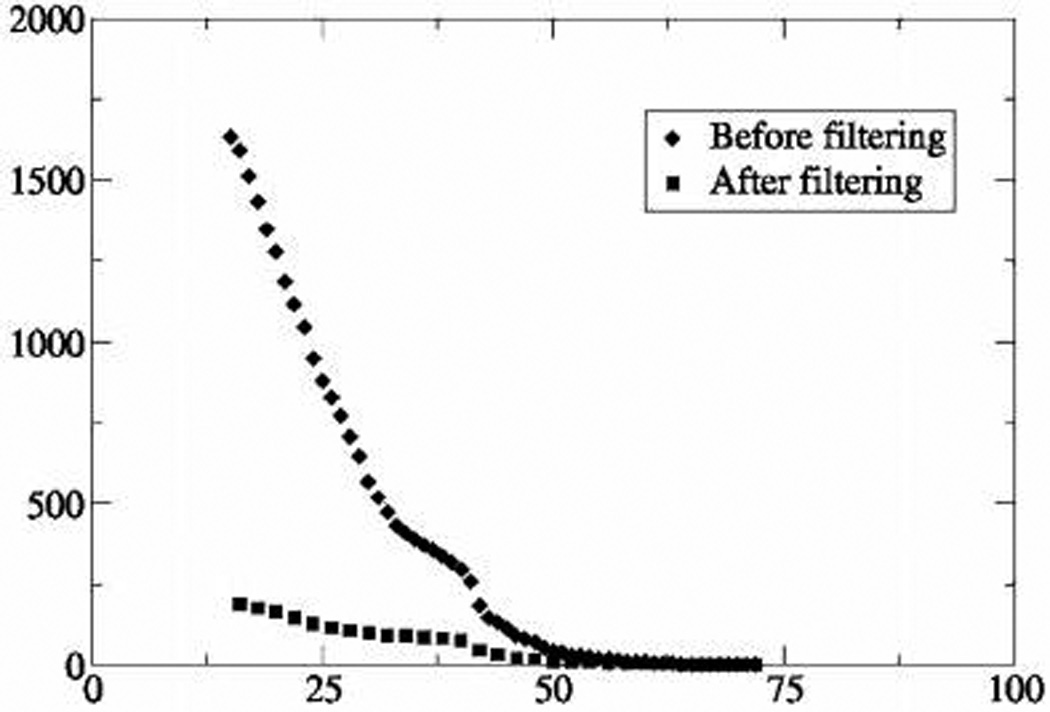
Only a small fraction of spectra acquired in LC-MS/MS runs matches peptides from target proteins upon database searches. The remaining, operationally termed background, spectra originate from a variety of poorly controlled sources and affect the throughput and confidence of database searches. Here, we report an algorithm and its software implementation that rapidly removes background spectra, regardless of their precise origin. The method estimates the dissimilarity distance between screened MS/MS spectra and unannotated spectra from a partially redundant background library compiled from several control and blank runs. Filtering MS/MS queries enhanced the protein identification capacity when searches lacked spectrum to sequence matching specificity. In sequence-similarity searches it reduced by, on average, 30-fold the number of orphan hits, which were not explicitly related to background protein contaminants and required manual validation. Removing high quality background MS/MS spectra, while preserving in the data set the genuine spectra from target proteins, decreased the false positive rate of stringent database searches and improved the identification of low-abundance proteins.
Figures


Similar articles
-
Spectral Library Search Improves Assignment of TMT Labeled MS/MS Spectra.J Proteome Res. 2018 Sep 7;17(9):3325-3331. doi: 10.1021/acs.jproteome.8b00594. Epub 2018 Aug 16. J Proteome Res. 2018. PMID: 30096983 Free PMC article.
-
DISMS2: A flexible algorithm for direct proteome- wide distance calculation of LC-MS/MS runs.BMC Bioinformatics. 2017 Mar 3;18(1):148. doi: 10.1186/s12859-017-1514-2. BMC Bioinformatics. 2017. PMID: 28253837 Free PMC article.
-
Micro-Data-Independent Acquisition for High-Throughput Proteomics and Sensitive Peptide Mass Spectrum Identification.Anal Chem. 2018 Aug 7;90(15):8905-8911. doi: 10.1021/acs.analchem.8b01026. Epub 2018 Jul 23. Anal Chem. 2018. PMID: 29984981
-
Protein identification by tandem mass spectrometry and sequence database searching.Methods Mol Biol. 2007;367:87-119. doi: 10.1385/1-59745-275-0:87. Methods Mol Biol. 2007. PMID: 17185772 Review.
-
[Progress in the spectral library based protein identification strategy].Sheng Wu Gong Cheng Xue Bao. 2018 Apr 25;34(4):525-536. doi: 10.13345/j.cjb.170321. Sheng Wu Gong Cheng Xue Bao. 2018. PMID: 29701026 Review. Chinese.
Cited by
-
A survey of computational methods and error rate estimation procedures for peptide and protein identification in shotgun proteomics.J Proteomics. 2010 Oct 10;73(11):2092-123. doi: 10.1016/j.jprot.2010.08.009. Epub 2010 Sep 8. J Proteomics. 2010. PMID: 20816881 Free PMC article. Review.
-
Treslin collaborates with TopBP1 in triggering the initiation of DNA replication.Cell. 2010 Feb 5;140(3):349-59. doi: 10.1016/j.cell.2009.12.049. Epub 2010 Jan 28. Cell. 2010. PMID: 20116089 Free PMC article.
-
Binding properties and dynamic localization of an alternative isoform of the cap-binding complex subunit CBP20.Nucleus. 2010 Sep-Oct;1(5):412-21. doi: 10.4161/nucl.1.5.12839. Nucleus. 2010. PMID: 21326824 Free PMC article.
-
Systematic Errors in Peptide and Protein Identification and Quantification by Modified Peptides.Mol Cell Proteomics. 2016 Aug;15(8):2791-801. doi: 10.1074/mcp.M115.055103. Epub 2016 May 23. Mol Cell Proteomics. 2016. PMID: 27215553 Free PMC article.
-
Direct regulation of Treslin by cyclin-dependent kinase is essential for the onset of DNA replication.J Cell Biol. 2011 Jun 13;193(6):995-1007. doi: 10.1083/jcb.201102003. Epub 2011 Jun 6. J Cell Biol. 2011. PMID: 21646402 Free PMC article.
References
-
- Aebersold R, Mann M. Mass spectrometry-based proteomics. Nature. 2003;422:198–207. - PubMed
-
- Pandey A, Mann M. Proteomics to study genes and genomes. Nature. 2000;405:837–846. - PubMed
-
- Venable JD, Dong MQ, Wohlschlegel J, Dillin A, Yates JR. Automated approach for quantitative analysis of complex peptide mixtures from tandem mass spectra. Nat. Methods. 2004;1:39–45. - PubMed
-
- Chalkley RJ, Baker PR, Hansen KC, Medzihradszky KF, Allen NP, Rexach M, Burlingame AL. Comprehensive analysis of a multidimensional liquid chromatography mass spectrometry dataset acquired on a quadrupole selecting, quadrupole collision cell, time-of-flight mass spectrometer: I. How much of the data is theoretically interpretable by search engines. Mol. Cell. Proteomics. 2005;4:1189–1193. - PubMed
-
- Cutillas PR, Biber J, Marks J, Jacob R, Stieger B, Cramer R, Waterfield M, Burlingame AL, Unwin RJ. Proteomic analysis of plasma membrane vesicles isolated from the rat renal cortex. Proteomics. 2004;5:101–112. - PubMed
Publication types
MeSH terms
Substances
Grants and funding
LinkOut - more resources
Full Text Sources
