

Induction of cell polarization and migration by a gradient of nanoscale variations in adhesive ligand spacing
- PMID: 18558788
- PMCID: PMC3811077
- DOI: 10.1021/nl801483w
Induction of cell polarization and migration by a gradient of nanoscale variations in adhesive ligand spacing
Abstract
Cell interactions with adhesive surfaces play a vital role in the regulation of cell proliferation, viability, and differentiation, and affect multiple biological processes. Since cell adhesion depends mainly on the nature and density of the adhesive ligand molecules, spatial molecular patterning, which enables the modulation of adhesion receptor clustering, might affect both the structural and the signaling activities of the adhesive interaction. We herein show that cells plated on surfaces that present a molecularly defined spacing gradient of an integrin RGD ligand can sense small but consistent differences in adhesive ligand spacing of about 1 nm across the cell diameter, which is approximately 61 mum when the spacing includes 70 nm. Consequently, these positional cues induce cell polarization and initiate cell migration and signaling. We propose that differential positional clustering of the integrin transmembrane receptors is used by cells for exploring and interpreting their environment, at high spatial sensitivity.
Figures
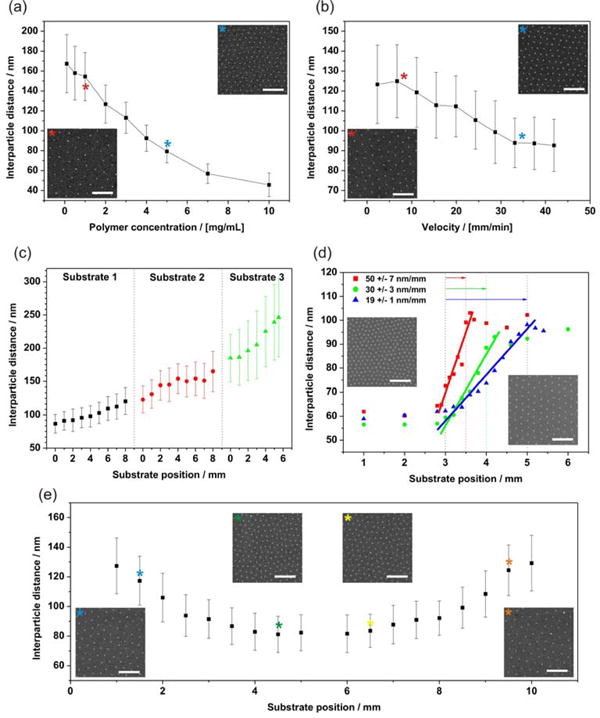
 PS(1826)-b-P[2VP(HAuCl4)0.5] (523) (c = 2 mg/mL, v = 40 mm/min to 8 mm/min) and Substrate 3:
 PS(5355)-b-P[4VP(HAuCl4)0.5] (714) (c = 1 mg/mL, v = 30 mm/min to 8 mm/min)]. (d) Particle spacing gradients with varying gradient strength of (19 +/- 1), (30 +/- 3) and (50 +/- 7) nm/mm. Gradients were generated from a PS(990)-b-P[2VP(HAuCl4)0.3](385) diblock copolymer solution of 5 mg/mL. Retraction procedure: 1) 3 mm constant retraction velocity of 40 mm/min; 2) 0.5, 1 or 2 mm gradual deceleration of retraction velocity from 40 to 8 mm/min; 3) constant retraction velocity of 8 mm/min. All scale bars: 300 nm. Error bars = s.d. of measured particle spacing. (e) Particle spacing for two conversely oriented gradients derived from a PS(1780)-b-P[2VP(HAuCl4)0.2](520) diblock copolymer solution of 2 mg/mL on one substrate plotted against substrate position. The retraction velocity was accelerated from 8 to 40 mm/min for the first gradient (0-5 mm) and decreased from 40 to 8 mm/min for the second gradient (6-10 mm) on a single substrate. The asterisks indicate the insets displaying SEM micrographs of the respective substrate positions. Insets show SEM micrographs of the substrate positions indicated by different asterisks (all scale bars: 300 nm)(error bars = Stdev of measured particle spacing).
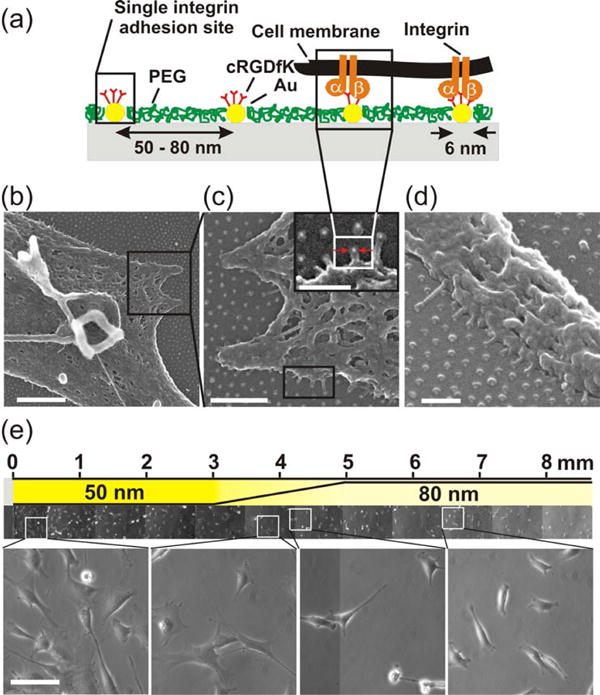
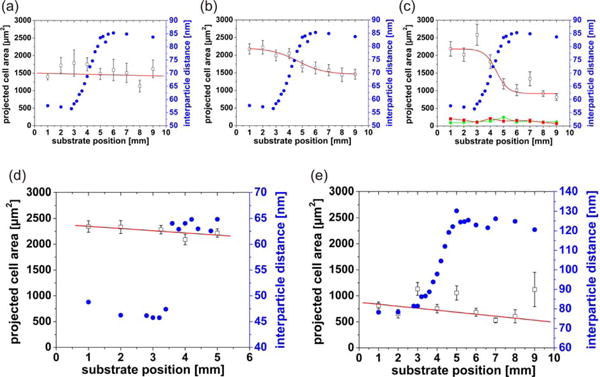
 ) and projected cell area (□) of cells plated after (a) 2.5 h (248 cells analysed); (b) 8 h (159 cells analysed); and (c) 23 h (200 cells analysed) as a function of substrate position, with a gradient strength of Δ15 nm/mm each. Control experiments with non-functionalized nanogold particles (
 ) and particle that were functionalized with RGE-peptides (
 ) proved the specificity of cell responses due to c(-RGDfK-) functionalization. Also the total number of cells that could be detected on the substrate with these controls was very little, i.e. couple of tens. Ligand patch spacing (
) and projected cell area (□) 23 h after cell plating as a function of substrate position, when the spacing range of c(-RGDfK-) patches covers (d) 45-65 nm, gradient strength Δ80 nm/mm; and (e) 80-110 nm, gradient strength Δ15 nm/mm.
) proved the specificity of cell responses due to c(-RGDfK-) functionalization. Also the total number of cells that could be detected on the substrate with these controls was very little, i.e. couple of tens. Ligand patch spacing (
) and projected cell area (□) 23 h after cell plating as a function of substrate position, when the spacing range of c(-RGDfK-) patches covers (d) 45-65 nm, gradient strength Δ80 nm/mm; and (e) 80-110 nm, gradient strength Δ15 nm/mm.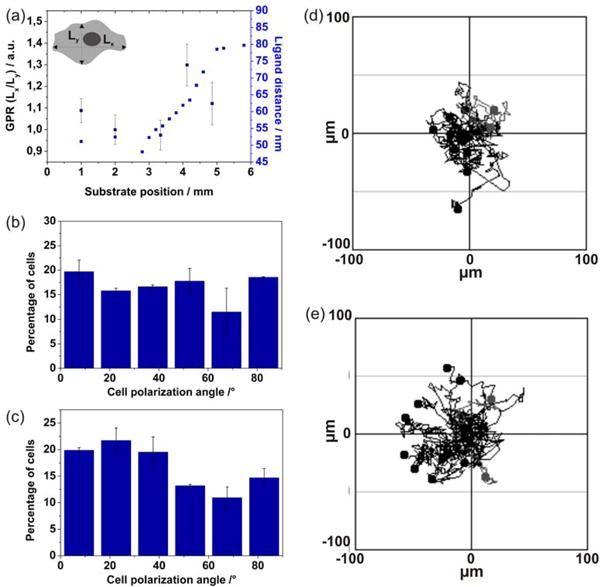
 ) as a function of substrate position for cells adhering to a gradient with a strength of Δ15 nm/mm. Cell polarization angle distribution of MC3T3 osteoblasts adhering to areas which consist of (b) a constant ligand patch spacing of ~50 nm and (c) a gradient as documented in (a) (0° = cells oriented along the gradient; 90° = cells oriented perpendicular to the gradient). REF fibroblast migration paths on areas which present (d) a constant ligand patch spacing of ~60 nm; and (e) a ligand patch gradient with a strength of Δ25 nm/mm covering 60 to 110 nm spacing. For migration studies cells were cultured for 13 h on the respective substrates and then imaged every 10 min. for 12 h.
Similar articles
-
Cell adhesion and motility depend on nanoscale RGD clustering.J Cell Sci. 2000 May;113 ( Pt 10):1677-86. doi: 10.1242/jcs.113.10.1677. J Cell Sci. 2000. PMID: 10769199
-
Nanopatterned Adhesive, Stretchable Hydrogel to Control Ligand Spacing and Regulate Cell Spreading and Migration.ACS Nano. 2017 Aug 22;11(8):8282-8291. doi: 10.1021/acsnano.7b03449. Epub 2017 Jul 20. ACS Nano. 2017. PMID: 28696653
-
Cell adhesion and polarisation on molecularly defined spacing gradient surfaces of cyclic RGDfK peptide patches.Eur J Cell Biol. 2008 Sep;87(8-9):743-50. doi: 10.1016/j.ejcb.2008.03.011. Epub 2008 Jun 24. Eur J Cell Biol. 2008. PMID: 18572273 Free PMC article.
-
Integrins in cell adhesion and signaling.Hum Cell. 1996 Sep;9(3):181-6. Hum Cell. 1996. PMID: 9183647 Review.
-
Integrin Clustering Matters: A Review of Biomaterials Functionalized with Multivalent Integrin-Binding Ligands to Improve Cell Adhesion, Migration, Differentiation, Angiogenesis, and Biomedical Device Integration.Adv Healthc Mater. 2018 Jun;7(12):e1701324. doi: 10.1002/adhm.201701324. Epub 2018 Mar 25. Adv Healthc Mater. 2018. PMID: 29577678 Review.
Cited by
-
Ovarian and Breast Cancer Migration Dynamics on Laminin and Fibronectin Bidirectional Gradient Fibers Fabricated via Multiphoton Excited Photochemistry.Cell Mol Bioeng. 2017 Aug;10(4):295-311. doi: 10.1007/s12195-017-0492-9. Epub 2017 Jul 10. Cell Mol Bioeng. 2017. PMID: 29177019 Free PMC article.
-
Programmable multivalent display of receptor ligands using peptide nucleic acid nanoscaffolds.Nat Commun. 2012 Jan 10;3:614. doi: 10.1038/ncomms1629. Nat Commun. 2012. PMID: 22233624 Free PMC article.
-
Combinatorial growth of oxide nanoscaffolds and its influence in osteoblast cell adhesion.J Appl Phys. 2012 May 15;111(10):102810-1028107. doi: 10.1063/1.4714727. Epub 2012 May 17. J Appl Phys. 2012. PMID: 22670064 Free PMC article.
-
Balancing forces: architectural control of mechanotransduction.Nat Rev Mol Cell Biol. 2011 May;12(5):308-19. doi: 10.1038/nrm3112. Nat Rev Mol Cell Biol. 2011. PMID: 21508987 Free PMC article. Review.
-
Engineered materials and the cellular microenvironment: a strengthening interface between cell biology and bioengineering.Trends Cell Biol. 2010 Dec;20(12):705-14. doi: 10.1016/j.tcb.2010.09.007. Epub 2010 Oct 20. Trends Cell Biol. 2010. PMID: 20965727 Free PMC article. Review.
References
-
- Geiger B, Bershadsky A, Pankov R, Yamada KM. Nature Reviews Molecular Cell Biology. 2001;2(11):793–805. - PubMed
-
- Meyer A, Auernheimer J, Modlinger A, Kessler H. Curr Pharmaceutical Design. 2006;12(22):2723–2747. - PubMed
-
- Chen CS, Mrksich M, Huang S, Whitesides GM, Ingber DE. Science. 1997;276(5317):1425–8. - PubMed
-
- Discher DE, Janmey P, Wang YL. Science. 2005;310(5751):1139–43. - PubMed
-
- Arnold M, Cavalcanti-Adam EA, Glass R, Blummel J, Eck W, Kantlehner M, Kessler H, Spatz JP. Chemphyschem. 2004;5(3):383–8. - PubMed
Publication types
MeSH terms
Substances
Grants and funding
LinkOut - more resources
Full Text Sources
Other Literature Sources
