

Spatial analysis of BSE cases in the Netherlands
- PMID: 18559085
- PMCID: PMC2441619
- DOI: 10.1186/1746-6148-4-21
Spatial analysis of BSE cases in the Netherlands
Abstract
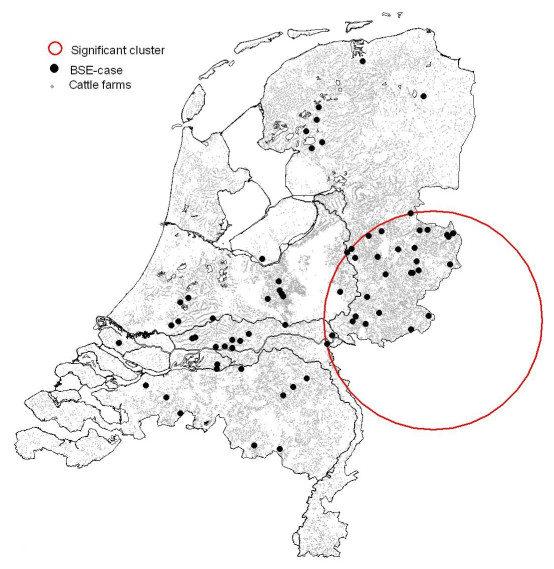
Background: In many of the European countries affected by Bovine Spongiform Encephalopathy (BSE), case clustering patterns have been observed. Most of these patterns have been interpreted in terms of heterogeneities in exposure of cattle to the BSE agent. Here we investigate whether spatial clustering is present in the Dutch BSE case data.
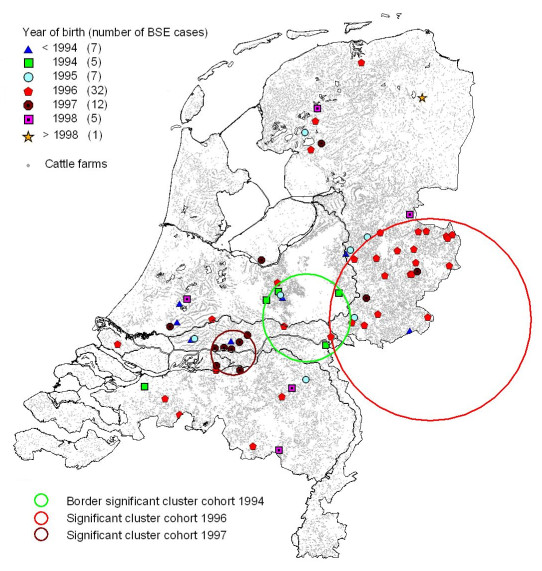
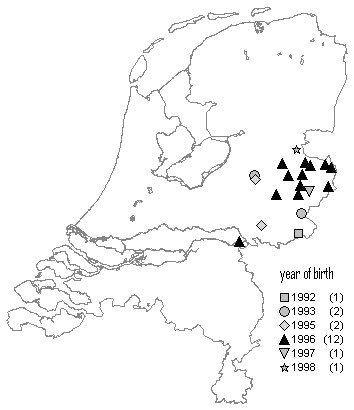
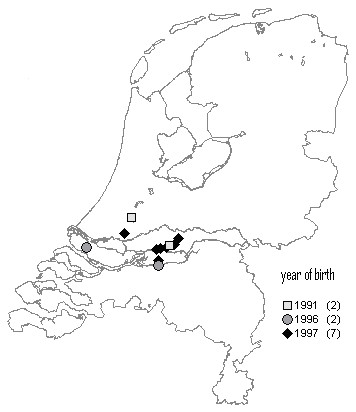
Results: We have found three spatial case clusters in the Dutch BSE epidemic. The clusters are geographically distinct and each cluster appears in a different birth cohort. When testing all birth cohorts together, only one significant cluster was detected. The fact that we found stronger spatial clustering when using a cohort-based analysis, is consistent with the evidence that most BSE infections occur in animals less than 12 or 18 months old.
Conclusion: Significant spatial case clustering is present in the Dutch BSE epidemic. The spatial clusters of BSE cases are most likely due to time-dependent heterogeneities in exposure related to feed production.
Figures
Similar articles
-
The epidemiology of bovine spongiform encephalopathy in the Republic of Ireland before and after the reinforced feed ban.Prev Vet Med. 2012 Jun 1;105(1-2):75-84. doi: 10.1016/j.prevetmed.2012.02.003. Epub 2012 Mar 3. Prev Vet Med. 2012. PMID: 22385779
-
A temporal-spatial analysis of bovine spongiform encephalopathy in Irish cattle herds, from 1996 to 2000.Can J Vet Res. 2005 Jan;69(1):19-25. Can J Vet Res. 2005. PMID: 15745218 Free PMC article.
-
BSE, feed and cattle in Switzerland: is there a spatial relation?Vet Res. 2007 May-Jun;38(3):409-18. doi: 10.1051/vetres:2007005. Epub 2007 Mar 13. Vet Res. 2007. PMID: 17506971
-
Bovine spongiform encephalopathy (BSE): causes and consequences of a common source epidemic.Am J Epidemiol. 1997 Jun 1;145(11):959-69. doi: 10.1093/oxfordjournals.aje.a009064. Am J Epidemiol. 1997. PMID: 9169904 Review.
-
[BSE in the Netherlands: an update].Tijdschr Diergeneeskd. 2007 Jun 1;132(11):428-34. Tijdschr Diergeneeskd. 2007. PMID: 17619308 Review. Dutch.
Cited by
-
Identifying the patterns and sizes of the first lumpy skin disease outbreak clusters in Northern Thailand with a high degree of dairy farm aggregation using spatio-temporal models.PLoS One. 2023 Nov 15;18(11):e0291692. doi: 10.1371/journal.pone.0291692. eCollection 2023. PLoS One. 2023. PMID: 37967138 Free PMC article.
-
Relative risk estimates from spatial and space-time scan statistics: are they biased?Stat Med. 2014 Jul 10;33(15):2634-44. doi: 10.1002/sim.6143. Epub 2014 Mar 18. Stat Med. 2014. PMID: 24639031 Free PMC article.
-
Scrapie prevalence in sheep of susceptible genotype is declining in a population subject to breeding for resistance.BMC Vet Res. 2010 May 14;6:25. doi: 10.1186/1746-6148-6-25. BMC Vet Res. 2010. PMID: 20470415 Free PMC article.
-
A scan statistic for continuous data based on the normal probability model.Int J Health Geogr. 2009 Oct 20;8:58. doi: 10.1186/1476-072X-8-58. Int J Health Geogr. 2009. PMID: 19843331 Free PMC article.
-
Spatiotemporal patterns of clinical bovine dermatophilosis in Zimbabwe 1995-2014.Onderstepoort J Vet Res. 2017 Jun 27;84(1):e1-e8. doi: 10.4102/ojvr.v84i1.1386. Onderstepoort J Vet Res. 2017. PMID: 28697608 Free PMC article.
References
-
- Heres L, Elbers ARW, Van Zijderveld FG. Identification of the Characteristics and Risk Factors of the BSE Epidemic in the Netherlands. Risk Analysis. 2007;27:1119–1129. - PubMed
-
- Wilesmith JW, Ryan JB, Stevenson MA, Morris RS, Pfeiffer DU, Lin D, Jackson R, Sanson RL. Temporal aspects of the epidemic of bovine spongiform encephalopathy in Great Britain: holding-associated risk factors for the disease. Veterinary Record. 2000;147:319–325. - PubMed
Publication types
MeSH terms
LinkOut - more resources
Full Text Sources
