Multicenter Study
. 2008 Jul 7;205(7):1573-82.
doi: 10.1084/jem.20072413. Epub 2008 Jun 16.

Copy number of FCGR3B, which is associated with systemic lupus erythematosus, correlates with protein expression and immune complex uptake

Affiliations
Multicenter Study

Copy number of FCGR3B, which is associated with systemic lupus erythematosus, correlates with protein expression and immune complex uptake

Lisa C Willcocks et al. J Exp Med. .

Abstract

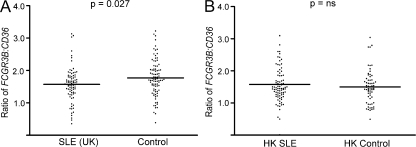
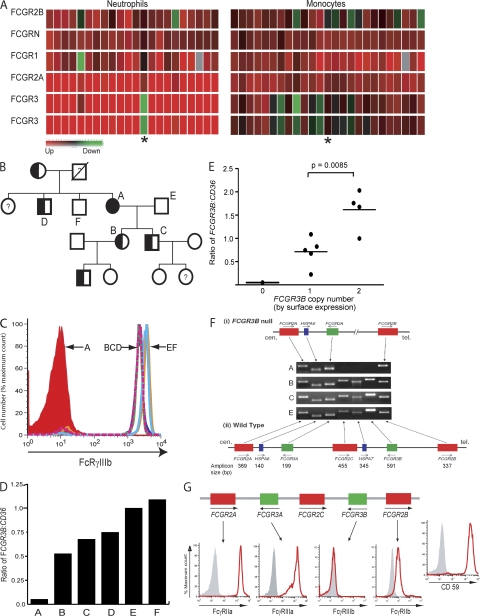
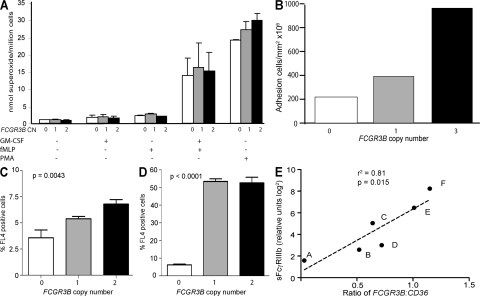
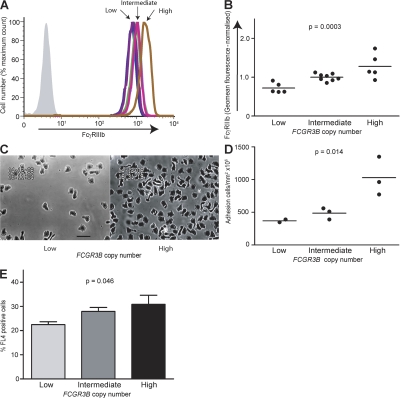
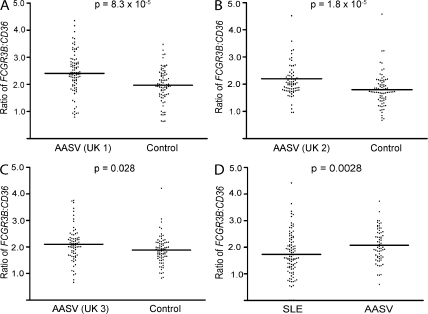
Copy number (CN) variation (CNV) has been shown to be common in regions of the genome coding for immune-related genes, and thus impacts upon polygenic autoimmunity. Low CN of FCGR3B has recently been associated with systemic lupus erythematosus (SLE). FcgammaRIIIb is a glycosylphosphatidylinositol-linked, low affinity receptor for IgG found predominantly on human neutrophils. We present novel data demonstrating that both in a family with FcgammaRIIIb-deficiency and in the normal population, FCGR3B CNV correlates with protein expression, with neutrophil uptake of and adherence to immune complexes, and with soluble serum FcgammaRIIIb. Reduced FcgammaRIIIb expression is thus likely to contribute to the impaired clearance of immune complexes, which is a feature of SLE, explaining the association between low FCGR3B CNV and SLE that we have confirmed in a Caucasian population. In contrast, antineutrophil cytoplasmic antibody-associated systemic vasculitis (AASV), a disease not associated with immune complex deposition, is associated with high FCGR3B CN. Thus, we define a role for FCGR3B CNV in immune complex clearance, a function that may explain why low FCGR3B CNV is associated with SLE, but not AASV. This is the first report of an association between disease-related gene CNV and variation in protein expression and function that may contribute to autoimmune disease susceptibility.


Figures

Figure 1.
Figure 1.
Association of low FCGR3B CN with UK, but not Hong Kong, SLE. qPCR was used to determine FCGR3B/CD36 ratios in normal controls and patients with SLE. In each case, results from 1 (representative of 2) qPCR plate are shown (all of the raw data are shown in Fig. S1, A and B). The horizontal bar indicates the mean. The P values shown indicate comparison of all cases and controls using a stratified Student's t test. (A) UK SLE patients, n = 171; UK controls, n = 176. (B) Hong Kong SLE patients, n = 159; Hong Kong controls, n = 150.
Figure 2.
Figure 2.
Correlation between FCGR3B CN and protein expression in a family. (A) Array of gene expression patterns (mRNA) for FCGR genes in neutrophils and monocytes of individuals with SLE. Each row corresponds to a gene, and each column to an individual. Red indicates increased expression compared with PBMC reference; green represents reduced expression. The patient (A in panel B) with no FCGR3B expression is marked with an asterisk. (B) Family tree of the FCGR3B-deficient patient A, showing Mendelian inheritance of the null allele. CN was determined using flow cytometry. (C) Flow cytometry of neutrophils stained for PE-labeled antibody to FcγRIIIb demonstrates reduced surface expression on cells from individuals B, C, and D (with a single FCGR3B copy) compared with individuals E and F, who have two FCGR3B copies. Geometric mean fluorescences were 7, 2,265, 2,241, 2,303, 3,484, and 3,730 for A–F, respectively. (D) Gene dosage of FCGR3B relative to CD36, determined by qPCR, for patient A (no FCGR3B), her daughter patient B, her son patient C, and her brother patient D (with a single FCGR3B copy), as well as for her husband patient E and her other brother patient F (with two copies of FCGR3B). (E) qPCR was performed on DNA from all family members whose FcγRIIIb expression had been determined by flow cytometry. Gene dosages of FCGR3B relative to CD36 (by qPCR) were significantly higher in those individuals who by flow cytometry were shown to have greater surface expression of FcγRIIIb. The horizontal bar indicates the mean. (F) Delineation of the extent of the deletion in patient A and family members B, C, and E using PCR; FCGR3B, HSPA7, and FCGR2C are absent. (G) A similar delineation using flow cytometry in patient A. FcγRIIa (neutrophils), FcγRIIb (neutrophils shown, confirmed on B cells, and not depicted) and FcγRIIIa (NK cells) are present (isotype control shaded gray), but FcγRIIIb (neutrophils) is absent. CD59 is expressed on neutrophils, thus GPI linkage is intact.
Figure 3.
Figure 3.
Correlation between FCGR3B CN and neutrophil function in a family. (A) No significant differences in superoxide anion production between family members with 0, 1, and 2 copies of FCGR3B were observed after Fc receptor–independent stimulation with GM-CSF, fMLP, or PMA (two-way ANOVA, P = ns). Mean and SEM from two independent experiments are shown. (B) Quantification of neutrophil adhesion to IgG-coated glass slides after 4 min of flow at a shear stress of 0.1 Pa in the FCGR3B-null individual and her single-copy daughter relative to the three CN control. (C) Percentages of neutrophils with bound, antibody-opsonized, Alexafluor-labeled ovalbumin after 10 min at 4°C, for family members with 0, 1, and 2 copies of FCGR3B. Mean and SEM are shown for triplicate repeats of one experiment that is representative of two. (D) Percentages of neutrophils with bound and internalized, antibody-opsonized, Alexafluor-labeled ovalbumin after 10 min at 37°C, for family members with 0, 1, and 2 copies of FCGR3B. Mean and SEM are shown for triplicate repeats of one experiment that is representative of two (the same experiment is shown in C). P values in C and D refer to one-way ANOVA with a post test for linear trend. (E) sFcγRIIIb in serum, as measured by ELISA, increases with FCGR3B CN in patient A's family (letters correspond to individuals shown in Fig. 1 B).
Figure 4.
Figure 4.
FCGR3B CN is proportional to gene expression and function in the normal population. Surface expression of FcγRIIIb increases with increasing FCGR3B CN. (A) Flow cytometry plot of neutrophils stained with PE-labeled anti-FcγRIIIb in one experiment that is representative of three. (B) Expression of FcγRIIIb (geometric mean fluorescence normalized in three separate experiments to the mean of intermediate CN individuals) correlates with gene dosage of FCGR3B. P value refers to one-way ANOVA with a post test for linear trend. The horizontal bar indicates the mean. (C) Neutrophil adhesion to IgG-coated glass slides after 4 min of flow at a shear stress of 0.1 Pa in an individual with low FCGR3B compared with that of an individual with high FCGR3B. Bar, 20 μm. (D) Neutrophil adhesion to bound IgG under flow conditions increases with FCGR3B CN (after 4 min of flow at a shear stress of 0.1 Pa) in two experiments, which were pooled. P value refers to one-way ANOVA with a post test for linear trend. The horizontal bar indicates the mean. (E) Uptake of immune complexes in individuals with low, intermediate, or high FCGR3B. Percentages of neutrophils positive for FL4 after 10 min incubation with antibody-opsonized, Alexafluor-labeled ovalbumin at 37°C are greater in individuals with more FCGR3B. Mean and SEM are shown for three to six individuals per group from two experiments. P value from nonparametric one way ANOVA (Kruskal-Wallis test).
Figure 5.
Figure 5.
Association of high FCGR3B CN with AASV. qPCR was used to determine FCGR3B/CD36 ratios in normal controls and cohorts of patients with AASV (cohorts described in Supplemental materials and methods). In each case, results from one representative qPCR plate are shown (all of the raw data are shown in Fig. S1 C). The horizontal bar indicates the mean. P values shown for each cohort indicate comparison of all cases and controls using a stratified Student's t test. (A–C) AASV versus control in three independent UK cohorts. (D) Single plate of SLE and AASV, compared using a Student's t test. Supplemental materials and methods and Fig. S1 C are available at http://www.jem.org/cgi/content/full/jem.20072413/DC1.

Similar articles

Cited by

References

    1. Redon, R., S. Ishikawa, K.R. Fitch, L. Feuk, G.H. Perry, T.D. Andrews, H. Fiegler, M.H. Shapero, A.R. Carson, W. Chen, et al. 2006. Global variation in copy number in the human genome. Nature. 444:444–454. - PMC - PubMed
    1. Freeman, J.L., G.H. Perry, L. Feuk, R. Redon, S.A. McCarroll, D.M. Altshuler, H. Aburatani, K.W. Jones, C. Tyler-Smith, M.E. Hurles, et al. 2006. Copy number variation: new insights in genome diversity. Genome Res. 16:949–961. - PubMed
    1. Potocki, L., W. Bi, D. Treadwell-Deering, C.M. Carvalho, A. Eifert, E.M. Friedman, D. Glaze, K. Krull, J.A. Lee, R.A. Lewis, et al. 2007. Characterization of Potocki-Lupski syndrome (dup(17)(p11.2p11.2)) and delineation of a dosage-sensitive critical interval that can convey an autism phenotype. Am. J. Hum. Genet. 80:633–649. - PMC - PubMed
    1. Gonzalez, E., H. Kulkarni, H. Bolivar, A. Mangano, R. Sanchez, G. Catano, R.J. Nibbs, B.I. Freedman, M.P. Quinones, M.J. Bamshad, K.K. Murthy, B.H. Rovin, W. Bradley, R.A. Clark, S.A. Anderson, R.J. O'Connell, B.K. Agan, S.S. Ahuja, R. Bologna, L. Sen, M.J. Dolan, and S.K. Ahuja. 2005. The influence of CCL3L1 gene-containing segmental duplications on HIV-1/AIDS susceptibility. Science. 307:1434–1440. - PubMed
    1. Aitman, T.J., R. Dong, T.J. Vyse, P.J. Norsworthy, M.D. Johnson, J. Smith, J. Mangion, C. Roberton-Lowe, A.J. Marshall, E. Petretto, et al. 2006. Copy number polymorphism in Fcgr3 predisposes to glomerulonephritis in rats and humans. Nature. 439:851–855. - PubMed

Publication types

MeSH terms