. 2008 Jun 15;22(12):1662-76.
doi: 10.1101/gad.1656808.

Conditional mouse osteosarcoma, dependent on p53 loss and potentiated by loss of Rb, mimics the human disease

Affiliations

Conditional mouse osteosarcoma, dependent on p53 loss and potentiated by loss of Rb, mimics the human disease

Carl R Walkley et al. Genes Dev. .

Abstract

Osteosarcoma is the most common primary malignant tumor of bone. Analysis of familial cancer syndromes and sporadic cases has strongly implicated both p53 and pRb in its pathogenesis; however, the relative contribution of these mutations to the initiation of osteosarcoma is unclear. We describe here the generation and characterization of a genetically engineered mouse model in which all animals develop short latency malignant osteosarcoma. The genetically engineered mouse model is based on osteoblast-restricted deletion of p53 and pRb. Osteosarcoma development is dependent on loss of p53 and potentiated by loss of pRb, revealing a dominance of p53 mutation in the development of osteosarcoma. The model reproduces many of the defining features of human osteosarcoma including cytogenetic complexity and comparable gene expression signatures, histology, and metastatic behavior. Using a novel in silico methodology termed cytogenetic region enrichment analysis, we demonstrate high conservation of gene expression changes between murine osteosarcoma and known cytogentically rearranged loci from human osteosarcoma. Due to the strong similarity between murine osteosarcoma and human osteosarcoma in this model, this should provide a valuable platform for addressing the molecular genetics of osteosarcoma and for developing novel therapeutic strategies.


Figures

Figure 1.
Figure 1.
Complete penetrance short Latency OS development. (A) Model of osteoblast differentiation and the putative stage of Osx-Cre expression. A and Figure 5D are composite diagrams based on the work of Aubin (2001), Franz-Odendaal et al. (2006), and Rodda and McMahon (2006). (B) Kaplan-Meier survival plots for the indicated genotypes: Osx-Cre+p53+/+pRbfl/fl, n = 49; Osx-Cre+ p53fl/flpRb+/+, n = 5; Osx-Cre+p53fl/+pRbfl/+, n = 30; Osx-Cre+p53fl/+pRbfl/fl, n = 9; Osx-Cre+p53fl/flpRbfl/+, n = 17; Osx-Cre+p53fl/fl pRbfl/fl, n = 12. (C) Representative presentation of OS of the lower jaw and femur, respectively.
Figure 2.
Figure 2.
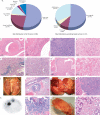
Tumor histology, site distribution, and metastatic disease. (a) Distribution of tumors in all animals and in a subset of animals excluding those that arise on the head respectively. (b,c) Osteoid-rich, partially mineralized tumor surrounding a tooth. (d) Osteoid-poor high-grade tumor. (e) Osteoid-poor fibroblastic tumor. (f) Osteoid-rich, partially mineralized tumor. (g) Osteoid-rich tumor. (h,i) Extraosseous extension of an osteoid-rich tumor. (j) Lung metastasis as indicated by the arrows. (k) Lung metastasis as revealed by F18 sodium fluoride microPET imaging; asterisk indicates the spine. (l,m) Histology of lung metastasis with focal areas of osteoid. (n) Disseminated metastasis through the liver and intestines as indicated by arrows. (o) Liver metastasis. (p,q) Histology of liver metastasis with osteoid. All sections stained with hematoxylin and eosin. Scale is as indicated on each image.
Figure 3.
Figure 3.
In vivo imaging with microPET/CT demonstrates rapid tumor formation. (A) microCT reconstruction of an animal with a femoral tumor with the overlay of microPET and microCT images. (B) microPET/CT of a calvarial tumor. (C) microPET/CT of a tibial tumor. The most F18 avid area of tumor corresponds with an area of lesser osteoid formation as revealed by microCT. (D) Eight-week-old animals were assessed for tumor burden by N18F revealing a positive lesion on the lower jaw; animal on the left is Osx-Cre+p53fl/flpRbfl/fl, animal on the right is Osx-Crep53fl/flpRbfl/+. Arrows indicate OS lesion.
Figure 4.
Figure 4.
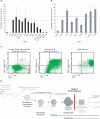
The preosteoblast as the candidate cell or origin of OS. (A) Analysis of differentiation status of mOS cell lines by quantitative real-time PCR. Expression levels of the indicated genes are compared with primary in vitro differentiated osteoblasts (normalized to 100%). Data are expressed as mean ± SEM; n = 4 OS cell lines, 3 wild-type primary Ob. (*) P < 0.05 (Student’s t-test). (B) Analysis of expression of genes implicated in human OS in the mOS cell lines by quantitative real-time PCR. Expression levels of the indicated genes are compared with primary in vitro differentiated osteoblasts (normalized to 100%). Data are expressed as mean ± SEM; n = 4 OS cell lines, 3 wild-type primary Ob. (*) P < 0.05 (Student’s t-test). (C) Representative flow cytometry assessment of expression of Sca-1 and CD51 on primary femur compact bone, primary mOS, and mOS cell lines, respectively. (D) Proposed model for OS development.
Figure 5.
Figure 5.
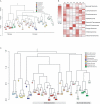
Mouse OS shares a transcriptional profile with human OS. (A) Hierarchical clustering of mouse and human tumor data sets separates data based on species and platform. Using this analysis technique mouse and human data sets separate because of species and platform differences. (B) Heat maps of the metagene projections that were defined for each of the seven human sarcoma types. The metagene expression level for each of the individual sarcoma types is shown. Following definition of the human metagene for each tumor type, the murine tumor sets were added, and the metagene projection as it applies to these data sets is shown. (C) Hierarchical clustering of the data set after metagene projection. mOS (red square) and human OS (salmon circle) associate, as do mouse synovial sarcoma (green square) and human synovial sarcoma (green circle).
Figure 6.
Figure 6.
Cytogenetic region enrichment analysis (CREA). (A) Schematic of the application of CREA to the analysis of OS. (B) Summary of CREA results for each of the indicated cytogenetic regions for primary mOS samples, mOS cell lines, and mouse synovial sarcoma.

Similar articles

Cited by

References

    1. Aubin J.E. Regulation of osteoblast formation and function. Rev. Endocr. Metab. Disord. 2001;2:81–94. - PubMed
    1. Batanian J.R., Cavalli L.R., Aldosari N.M., Ma E., Sotelo-Avila C., Ramos M.B., Rone J.D., Thorpe C.M., Haddad B.R. Evaluation of paediatric osteosarcomas by classic cytogenetic and CGH analyses. Mol. Pathol. 2002;55:389–393. - PMC - PubMed
    1. Becher O.J., Holland E.C. Genetically engineered models have advantages over xenografts for preclinical studies. Cancer Res. 2006;66:3355–3358. - PubMed
    1. Brenner W., Vernon C., Muzi M., Mankoff D.A., Link J.M., Conrad E.U., Eary J.F. Comparison of different quantitative approaches to 18F-fluoride PET scans. J. Nucl. Med. 2004;45:1493–1500. - PubMed
    1. Bridge J.A., Bhatia P.S., Anderson J.R., Neff J.R. Biologic and clinical significance of cytogenetic and molecular cytogenetic abnormalities in benign and malignant cartilaginous lesions. Cancer Genet. Cytogenet. 1993;69:79–90. - PubMed

Publication types

MeSH terms