. 2008 Jun 15;68(12):4518-24.
doi: 10.1158/0008-5472.CAN-07-5999.

Stopping treatment can reverse acquired resistance to letrozole

Affiliations

Stopping treatment can reverse acquired resistance to letrozole

Gauri J Sabnis et al. Cancer Res. .

Abstract

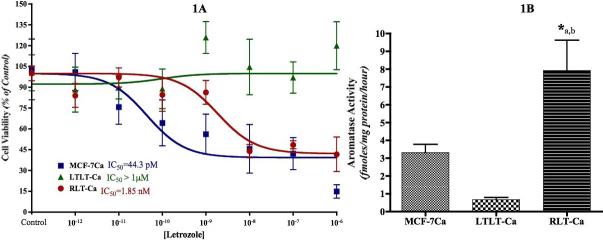
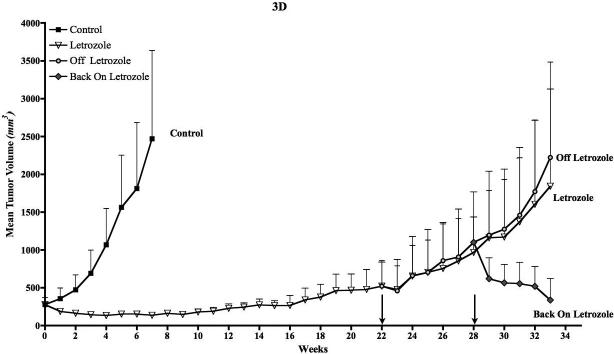
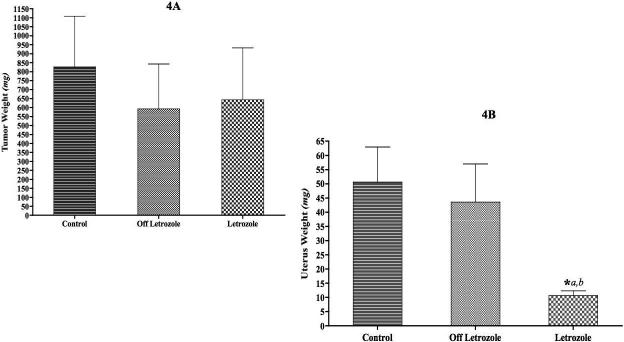
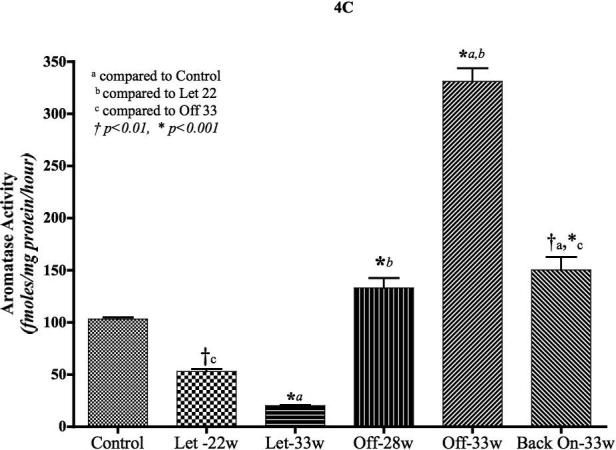
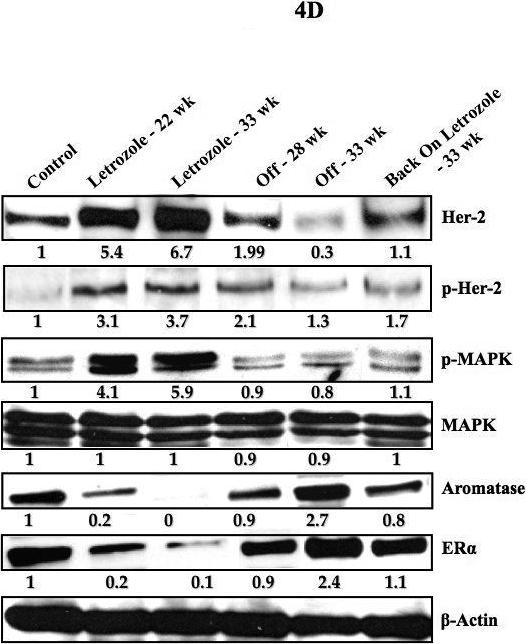
Using the intratumoral aromatase xenograft model, we have observed that despite long-lasting growth inhibition, tumors eventually begin to grow during continued letrozole treatment. In cells isolated from these long-term letrozole-treated tumors (LTLT-Ca), estrogen receptor-alpha (ERalpha) levels were decreased, whereas signaling proteins in the mitogen-activated protein kinase cascade were up-regulated along with human epidermal growth factor receptor 2 (Her-2). In the current study, we evaluated the effect of discontinuing letrozole treatment on the growth of letrozole-resistant cells and tumors. The cells formed tumors equally well in the absence or presence of letrozole and had similar growth rates. After treatment was discontinued for 6 weeks, letrozole was administered again. Marked tumor regression was observed with this second course of letrozole treatment. Similarly, in MCF-7Ca xenografts, a 6-week break in letrozole treatment prolonged the responsiveness of the tumors to letrozole. To understand the mechanisms of this effect, LTLT-Ca cells were cultured in the absence of letrozole for 16 weeks. The resulting cell line (RLT-Ca) exhibited properties similar to MCF-7Ca cells. The cell growth was inhibited by letrozole and stimulated by estradiol. The expression of phosphorylated mitogen-activated protein kinase (MAPK) was reduced and ERalpha and aromatase levels increased compared with LTLT-Ca cells and were similar to levels in MCF-7Ca cells. These results indicate that discontinuing treatment can reverse letrozole resistance. This could be a beneficial strategy to prolong responsiveness to aromatase inhibitors for patients with breast cancer.


Figures

Figure 1
Figure 1. A: Effect of letrozole on proliferation of MCF-7Ca, LTLT-Ca and RLT-Ca cells in vitro
Viability of cells was measured by MTT assay after 6 day treatment with letrozole as described in Materials and Methods. The treatment with letrozole is significantly more effective in MCF-7Ca and RLT-Ca cells compared to LTLT-Ca cells (p = 0.0003). Figure 1B: Aromatase activity of MCF-7Ca, LTLT-Ca and RLT-Ca cells: Aromatase activity was measured by 3H2O release assay as described in Materials and Methods. RLT-Ca cells exhibit significantly higher aromatase activity compared to MCF-7Ca (*a, p<0.05) and LTLT-Ca cells (*b, p<0.001).
Figure 2
Figure 2. A: Effect of Δ4A on proliferation of LTLT-Ca and RLT-Ca cells
Viability of cells was measured by MTT assay after 6 day treatment as described in Materials and Methods. Compared to LTLT-Ca cells, RLT-Ca cells exhibit a significantly marked stimulation of proliferation in response to Δ4A at concentrations of 10−11M and 10−10M (* p <0.001). LTLT-Ca cells are markedly inhibited by Δ4A at all concentrations (p<0.01), but only at concentration of 10−6M Δ4A in RLT-Ca cells (p<0.05) and 10−5M and 10−4M (* p <0.001) Figure 2B: Effect of estradiol on proliferation of LTLT-Ca and RLT-Ca cells: Viability of cells was measured by MTT assay after 6 day treatment as described in Materials and Methods. Compared to LTLT-Ca cells, RLT-Ca cells exhibit a significantly marked stimulation of proliferation in response to E2 at concentrations of 10−12M through 10−10M (* p <0.001). E2 markedly inhibited growth of LTLT-Ca cells at concentrations 10−6M through 104M (‡ p<0.01), but only at 10−4M E2 in RLT-Ca cells (p<0.01). Figure 2C: Protein expression profile of RLT-Ca cells compared to MCF-7Ca and LTLT-Ca cells: Expression of proteins was examined using western imunoblotting as described in Materials and Methods. Blot shows phospho-MAPK at 42−44 kDa, Her-2 at 185 kDa, ERα at 66 kDa and β-actin at 45 kDa. The blots were stripped and re-probed for β-actin to verify equal loading. The blots show a single representative of three independent experiments.
Figure 3
Figure 3. A: Effect of letrozole treatment at on the growth of LTLT-Ca xenografts after 4 months off letrozole
LTLT-Ca xenografts were grown in female OVX nude mice as described in Materials and Methods. The mice were kept off letrozole treatment for a period of 4 months. After which they were grouped into two groups, shown as on and off letrozole. The mice in the control and letrozole treated group exhibited significantly different growth rate. The difference in the exponential parameter governing growth was 42.3, p = 0.04. Figure 3B: Effect of letrozole on the tumor weight of the LTLT-Ca xenografts: The mean tumor weight of control mice was 607.5 ± 225.5 mg which was significantly different from those of the letrozole treated mice (112.5 ± 84.77 mg); p = 0.024. The graph shows mean ± SEM. Figure 3C: Effect of letrozole on the uterine weight of the LTLT-Ca xenografts: The mean uterine weight of control mice was 83 ± 21.45 mg which was significantly different from those of the letrozole treated mice (39.67 ± 9.14 mg); p<0.01. The graph shows mean ± SEM. Figure 3D: Discontinuous treatment prolongs responsiveness of MCF-7Ca xenografts to letrozole: The tumors of MCF-7Ca cells were grown as described in materials and methods. The letrozole and off groups were sacrificed on week 34. The graph shows mean tumor volume ± SEM versus time (weeks).
Figure 4
Figure 4. A: Effect of letrozole on/off treatment the tumor weight of the MCF-7Ca xenografts
The mean tumor weight of control mice was 1.38 ± 0.39 g, letrozole treated mice was 0.92 ± 0.36 g and off letrozole mice was 0.74 ± 0.34g. The graph shows mean ± SEM. The mean tumor weights were not significantly across the groups (p = 0.46). Figure 4B: Effect of letrozole on/off treatment the uterus weight of the MCF-7Ca xenografts: The mean uterus weight of letrozole treated mice was 10.71 ± 1.658 mg which was significantly different from those of the control mice (50.67 ± 12.28 mg); p = 0.0006 (*a) and “off letrozole” mice (43.63 ± 13.44 mg); p = 0.02 (*b). The mean uterine weight of control and off letrozole mice was not significantly different (p = 1). The graph shows mean ± SEM. Pearson correlation coefficient for uterine weight and tumors in letrozole group was −0.19 and 0.14 (left and right tumor respectively); p= 0.68 and 0.76- no correlation. Pearson correlation coefficient for uterine weight and tumors in control group was 0.96 and 0.96 (left and right tumor respectively); p = 0.003 and 0.002 – very strong positive correlation is present. Pearson correlation coefficient for uterine weight and tumors in off group was 0.95 and 0.84 (left and right tumor respectively); p= 0.0002 and 0.009– very strong positive correlation is present. Figure 4C: Aromatase activity in the tumors of MCF-7Ca cells treated with letrozole: Aromatase activity was measured using 3H2O release assay as described in materials and methods. Control tumors were collected at week 7; letrozole treated tumors were collected at week 22 (when the group was split into on and off letrozole) and week 33 (when experiment was terminated); off letrozole tumors at week 28 (when group was split into off and back on letrozole) and week 33 (when experiment was terminated); back on letrozole at week 33. The graph represents mean ± SEM. One Way ANOVA with post-hoc Tukey multiple comparison test was performed to examine statistical significance. Figure 4D: Protein expression profile of the tumors of MCF-7Ca cells treated with letrozole: Expression of proteins was examined using western imunoblotting as described in Materials and Methods. Lane 1 Δ4A treated control, lane 2 letrozole treated tumor at week 22, lane 3 letrozole treated tumors at week 33, lane 4 tumor from “off” group at week 28, lane 5 “off” tumors at week 33 and lane 6 tumor from “back on” group at week 33. Blot shows Her-2 and p-Her-2 at 185 kDa, phospho-MAPK and MAPK at 42−44 kDa, aromatase at 55kDa, ERα at 66 kDa and β-actin at 45 kDa. The blots were stripped and re-probed for β-actin to verify equal loading. The blots show a single representative of three independent experiments.

Similar articles

Cited by

References

    1. Yue W, Brodie A. MCF-7 human breast carcinomas in nude mice as a model for evaluating aromatase inhibitors. J Steroid Biochem Mol Biol. 1993;44:671–3. - PubMed
    1. Yue W, Zhou D, Chen S, Brodie A. A new nude mouse model for postmenopausal breast cancer using MCF-7 cells transfected with the human aromatase gene. Cancer Res. 1994;54:5092–5. - PubMed
    1. Long BJ, Jelovac D, Handratta V, et al. Therapeutic strategies using the aromatase inhibitor letrozole and tamoxifen in a breast cancer model. Journal of the National Cancer Institute. 2004;96:456–65. - PubMed
    1. Goss PE. Preventing relapse beyond 5 years: the MA.17 extended adjuvant trial. Seminars in oncology. 2006;33:S8–12. - PubMed
    1. Goss PE, Ingle JN, Martino S, et al. Efficacy of Letrozole Extended Adjuvant Therapy According to Estrogen Receptor and Progesterone Receptor Status of the Primary Tumor: National Cancer Institute of Canada Clinical Trials Group MA.17. J Clin Oncol. 2007 - PubMed

Publication types

MeSH terms