. 2008 Jun 15;68(12):4606-13.
doi: 10.1158/0008-5472.CAN-07-5046.

Matrix metalloproteinase 9 is a mediator of epidermal growth factor-dependent e-cadherin loss in ovarian carcinoma cells

Affiliations

Matrix metalloproteinase 9 is a mediator of epidermal growth factor-dependent e-cadherin loss in ovarian carcinoma cells

Karen D Cowden Dahl et al. Cancer Res. .

Abstract

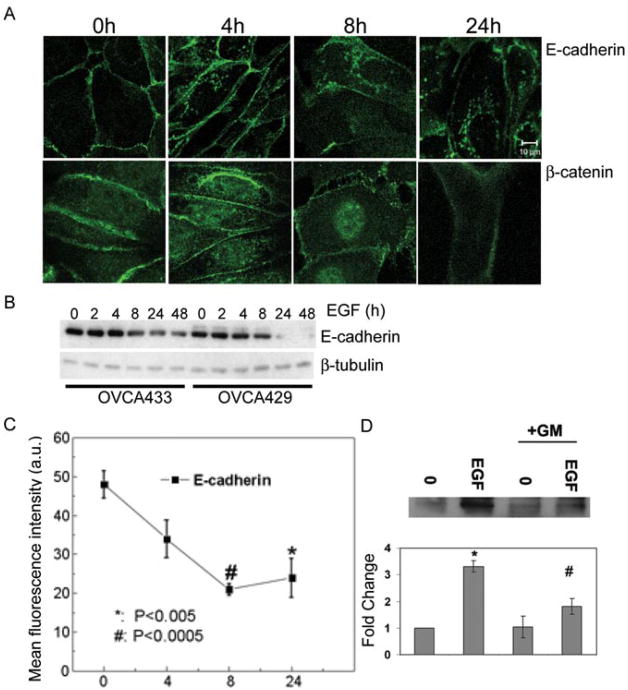
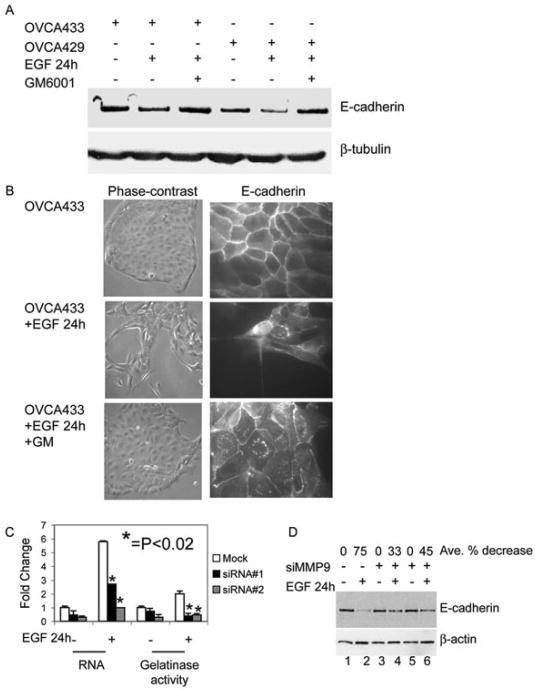
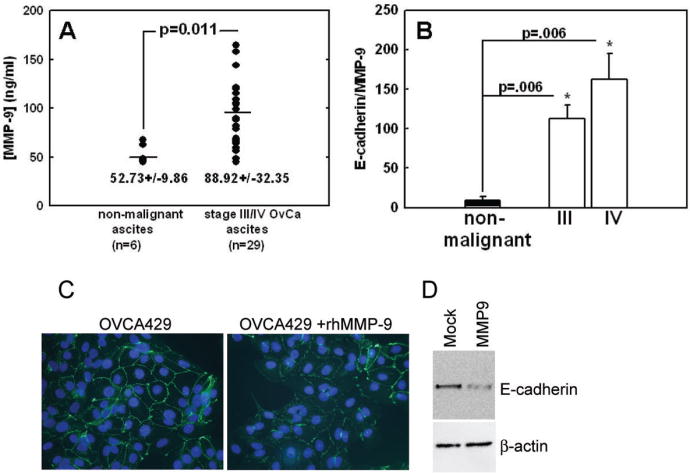
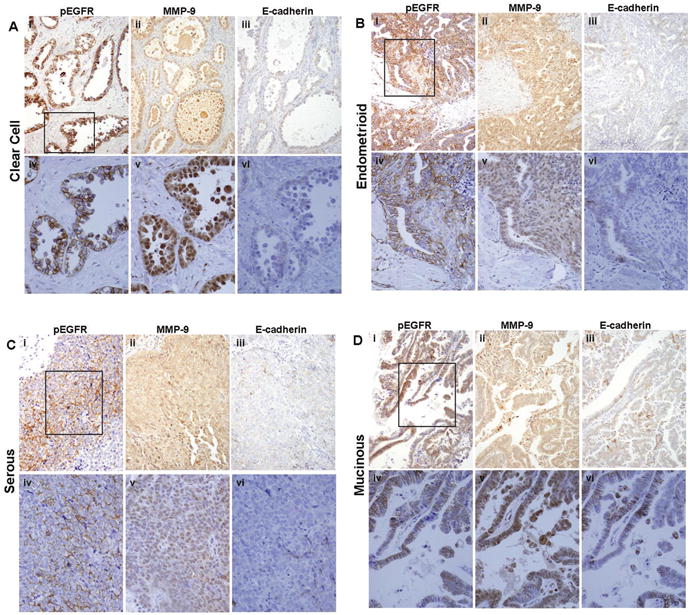
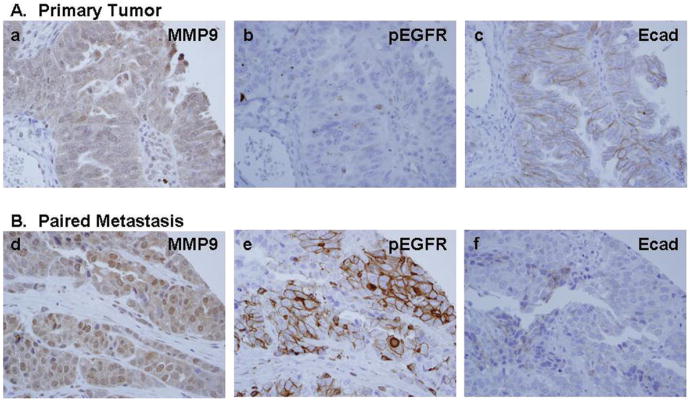
Epidermal growth factor (EGF) receptor (EGFR) is frequently elevated in epithelial ovarian cancer, and E-cadherin expression is often reduced in advanced disease. In this study, we investigated a mechanism by which EGFR activation promotes disruption of adherens junctions through induction of matrix metalloproteinase 9 (MMP-9). We show that EGFR activation down-modulates E-cadherin, and broad spectrum MMP inhibition ameliorates EGF-stimulated junctional disruption and loss of E-cadherin protein. MMP-9 involvement in EGF-dependent down-regulation of E-cadherin was determined by siRNA specifically directed against MMP-9. Furthermore, treatment with recombinant MMP-9 or transient expression of MMP-9 is sufficient to reduce E-cadherin levels in differentiated ovarian tumor cells. Stable overexpression of MMP-9 led to a loss of E-cadherin and junctional integrity, and promoted a migratory and invasive phenotype. Thus, elevated MMP-9 protein expression is sufficient for junctional disruption and loss of E-cadherin in these cells. The associations between EGFR activation, MMP-9 expression, and E-cadherin were investigated in human ovarian tumors and paired peritoneal metastases wherein immunohistochemical staining for activated (phospho) EGFR and MMP-9 colocalized with regions of reduced E-cadherin. These data suggest that regulation of MMP-9 by EGFR may represent a novel mechanism for down-modulation of E-cadherin in ovarian cancer.


Figures

Figure 1
Figure 1
EGF treatment disrupts adherens junctions and down-modulates E-cadherin. A. OVCA 433 cells were treated with 20nM EGF for the indicated times and distribution of E-cadherin and β-catenin was detected by immunofluorescence as described in “Materials and Methods”. Original magnification was 88.2×. B. OVCA 433 and OVCA 429 cells were treated with 20nM EGF indicated times. Protein lysates were collected and 10μg of total protein was resolved by PAGE, transferred to nitrocellulose membrane, and immunoblotted with anti-E-cadherin or anti-β-tubulin followed by peroxidase-conjugated secondary antibody and ECL detection. C. The surface expression of E-cadherin following EGF treatment for indicated times was measured using flow cytometry as described under “Materials and Methods”. Data shown are expressed in arbitrary units (a.u.) and represent the mean fluorescence intensity for three independent experiments (mean-/+ S.D.) *P<0.005; #P<0.005 compared to untreated control. D. Cells were treated with EGF for 8 hours or EGF in the presence of 50μM GM6001 (GM), an MMP inhibitor. The E-cadherin ectodomain was immunoprecipitated from conditioned media collected for each treatment group. The 80kd band from a representative experiment is shown in the upper panel and densitometric data of band intensity from three independent experiments is shown in the lower panel. Results were normalized against the densitometric reading of untreated cells and represent three independent experiments. Data shown represent the mean -/+ S. D. * represents statistical significance comparing untreated cells to cell treated with EGF. # represents statistical significance comparing EGF treated cells to cells treated with both EGF and GM. P<0.005 for both comparisons.
Figure 2
Figure 2
MMP involvement in EGF-induced loss of E-cadherin. A. Serum-deprived OVCA 433 and OVCA 429 cells were untreated or treated with 20nM EGF or 20nM EGF and 50μM GM6001 (GM) for 24 hours. Protein lysates were collected and 35μg of total protein was resolved by PAGE, transferred to nitrocellulose membrane, and anti-E-cadherin or anti-β-tubulin were detected by western blot as described in “Materials and Methods”. B. OVCA 433 cells were treated as in (A) and images of cell morphology (left panels) or distribution of E-cadherin (right panels) were obtained by phase-contrast microscopy (original magnification 100×) and immunofluorescence (original magnification 400×), respectively. C. OVCA 433 cells were transfected with a negative control siRNA (Mock) or two independent MMP-9 siRNA oligos (si#1 and si#2). Transfected OVCA 433 cells were serum-starved then left or treated with 20nM EGF for 24 hours. RNA and conditioned-media were collected and Q-PCR and gelatin zymography were performed for MMP-9 to determine the efficiency of siRNA knockdown. Results were normalized to mock untreated cells. Error bars represent +/- standard error of the mean (SEM). *p<0.02. Statistical significance is shown for siRNA transfected cells treated with EGF compared to mock transfected cells treated with EGF. D. OVCA 433 cells were transfected with a negative control siRNA (lanes 1 and 2) or two independent MMP-9 siRNA oligos (si#1 lanes 3 and 4; si#2 lanes 5 and 6). Transfected cells were serum-starved for 24 hours and then untreated or treated with EGF for 24 hours. Protein was collected and western blots for E-cadherin and β-actin were performed in “Materials and Methods”. The average percent decrease in E-cadherin protein was determined by Kodak Imager densitometry. SiRNA transfected cells treated with EGF were compared to EGF-treated mock transfected cells.
Figure 3
Figure 3
Relationship between MMP-9 and E-cadherin loss. A. Analysis of MMP-9 levels in ascites fluid. Ascites samples from 29 women with stage III or IV ovarian cancer and 6 women with non-malignant ascites were diluted 1:100 in phosphate buffered saline (PBS) and analyzed using a human MMP-9 (total) Immunoassay (R&D Systems, Minneapolis, MN) according to manufacturer's specifications. B. Relationship between soluble E-cadherin ectodomain (24) and MMP-9 levels in malignant and non-malignant ascites fluid. C. Recombinant MMP-9 decreases junctional E-cadherin. OVCA 429 cells were untreated or treated with recombinant human MMP 9 (rHMMP-9) for 48 hours. Distribution of E-cadherin was detected by immunofluorescence using anti-E-cadherin and nuclei were visualized with DAPI. Original magnification 400×. D. Transiently transfected MMP-9 decreases E-cadherin. OVCA 433 cells were transiently transfected with MMP-9 and cell lysates were collected 48 hours post-transfection. E-cadherin and β-actin were detected by immunoblot analysis as described in “Materials and Methods”.
Figure 4
Figure 4
MMP-9 overexpression is sufficient to generate an invasive phenotype. A. OVCA 433 cells were stably transfected with MMP-9 (M9) or control vector (pCDNA3=V3). Conditioned media was also collected from stable lines and zymography assays were performed to detect MMP-9 gelatinase activity. B. Lysates were prepared from vector control (V3) and MMP-9 (M9) cells. Levels of E-cadherin and β-tubulin were detected by immunoblot analysis. C. Images of morphology and distribution of E-cadherin in V3 and M9 cells were obtained by phase-contrast microscopy (original magnification 100×) and immunofluorescence (original magnification 400×), respectively. D. Cell migration and invasion of V3 and M9 cells were evaluated following cell seeding in the absence of serum onto porous cell culture membrane inserts without or with Matrigel, respectively. Cells were allowed to migrate or invade for 48 hours, and cells on the underside of the insert were stained with crystal violet, photographed, and counted as described in “Materials and Methods”. Values shown represent the average number of migratory cells per field (minimum of 3 fields per membrane) for three independent experiments performed in duplicate -/+ SEM. *P<0.005.
Figure 5
Figure 5
Immunohistochemical analysis of serial human ovarian tumor sections for EGFR activation, MMP-9, and E-cadherin. Serial sections of primary ovarian tumor samples were stained with antibodies to active (phospho-) EGFR, MMP-9, or E-cadherin (as indicated) and scored as described in “Materials and Methods”. EGFR activation was significantly positively correlated with MMP-9 expression (Spearman's rho=.429, p<.0001), and examination of serial tumor sections revealed numerous areas with reduced levels of E-cadherin that co-localized with strong positive staining for activated EGFR and MMP-9. (A) Clear cell carcinoma; (B) endometrioid; (C) serous; (D) mucinous. (i-iii)-200× magnification; (iv-vi)-400× magnification. Black box (i) designates area magnified in (iv-vi).
Figure 6
Figure 6
Immunochemical analysis of serial sections from paired primary ovarian tumors and metastatic lesions. Serial sections of (A) primary serous ovarian tumor samples and (B) paired peritoneal metastases were stained with antibodies to active (phospho-) EGFR, MMP-9, or E-cadherin (as indicated) and scored as described in “Materials and Methods”. MMP-9 expression was high in all phospho-EGFR positive metastases, while the majority concomitantly exhibited decreased E-cadherien staining relative to the paired primary tumor. 400× magnification.

Similar articles

Cited by

References

    1. Jemal A, Siegel R, Ward E, et al. Cancer statistics, 2006. CA Cancer J Clin. 2006;56:106–30. - PubMed
    1. Mendelsohn J, Baselga J. Status of epidermal growth factor receptor antagonists in the biology and treatment of cancer. J Clin Oncol. 2003;21:2787–99. - PubMed
    1. Bast RC, Jr, Pusztai L, Kerns BJ, et al. Coexpression of the HER-2 gene product, p185HER-2, and epidermal growth factor receptor, p170EGF-R, on epithelial ovarian cancers and normal tissues. Hybridoma. 1998;17:313–21. - PubMed
    1. Maihle NJ, Baron AT, Barrette BA, et al. EGF/ErbB receptor family in ovarian cancer. Cancer Treat Res. 2002;107:247–58. - PubMed
    1. Perez-Soler R. HER1/EGFR targeting: refining the strategy. Oncologist. 2004;9:58–67. - PubMed

Publication types

MeSH terms