. 2008 Jun 15;68(12):4674-82.
doi: 10.1158/0008-5472.CAN-07-6353.

Identification of tumor-initiating cells in a p53-null mouse model of breast cancer

Affiliations

Identification of tumor-initiating cells in a p53-null mouse model of breast cancer

Mei Zhang et al. Cancer Res. .

Abstract

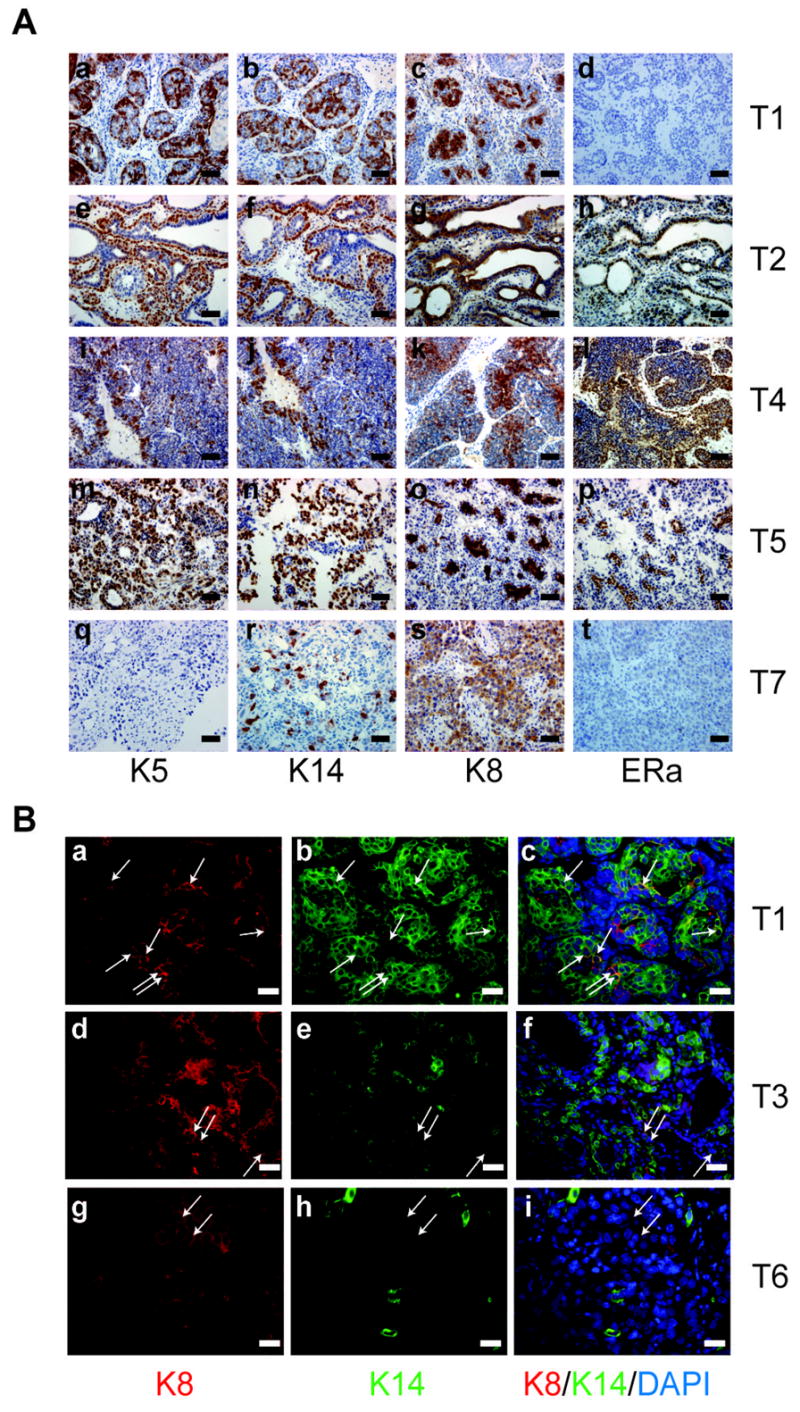
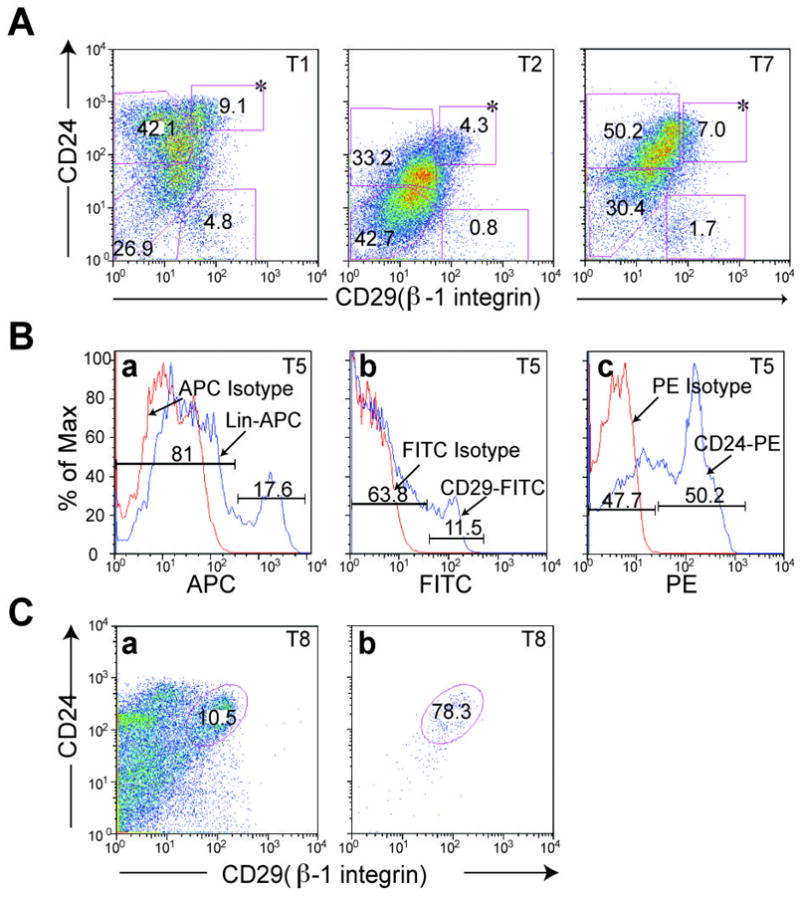
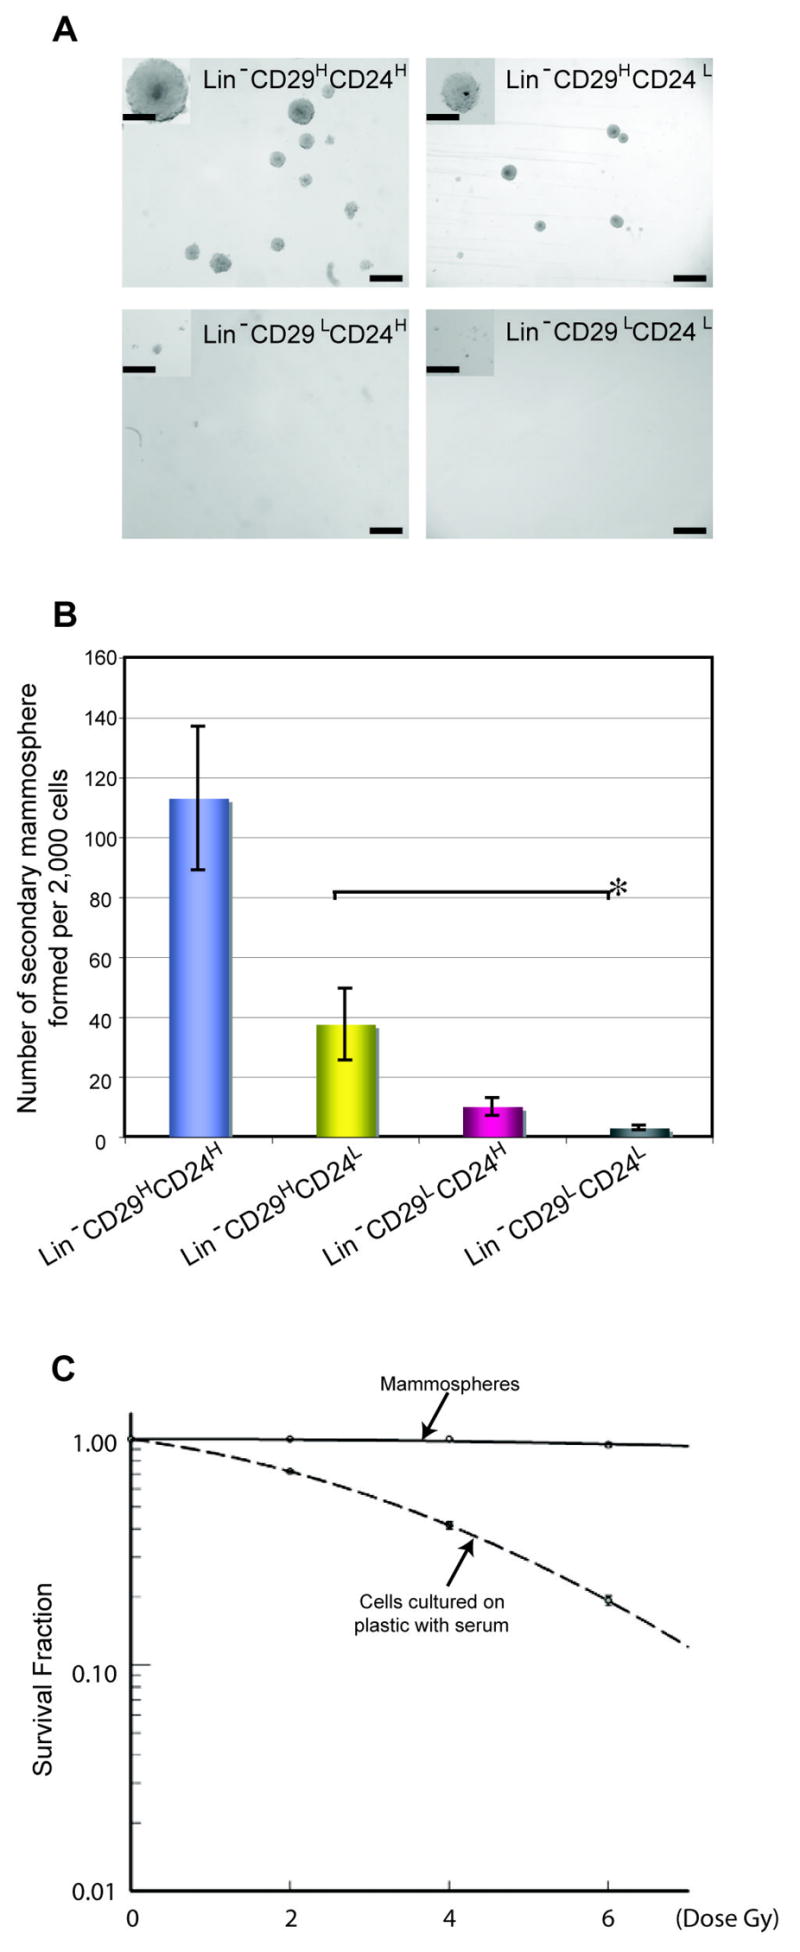
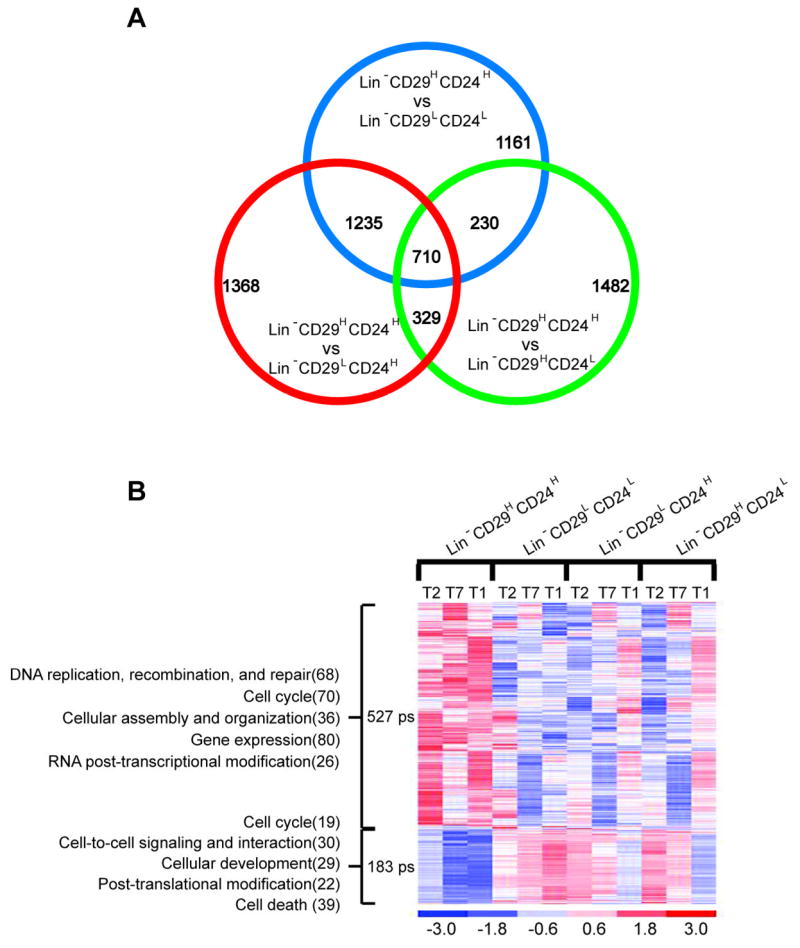
Using a syngeneic p53-null mouse mammary gland tumor model that closely mimics human breast cancer, we have identified, by limiting dilution transplantation and in vitro mammosphere assay, a Lin(-)CD29(H)CD24(H) subpopulation of tumor-initiating cells. Upon subsequent transplantation, this subpopulation generated heterogeneous tumors that displayed properties similar to the primary tumor. Analysis of biomarkers suggests the Lin(-)CD29(H)CD24(H) subpopulation may have arisen from a bipotent mammary progenitor. Differentially expressed genes in the Lin(-)CD29(H)CD24(H) mouse mammary gland tumor-initiating cell population include those involved in DNA damage response and repair, as well as genes involved in epigenetic regulation previously shown to be critical for stem cell self-renewal. These studies provide in vitro and in vivo data that support the cancer stem cell (CSC) hypothesis. Furthermore, this p53-null mouse mammary tumor model may allow us to identify new CSC markers and to test the functional importance of these markers.


Figures

Figure 1
Figure 1
Immunostaining of paraffin-embedded sections illustrating the heterogeneity of p53 null mammary tumors. K5, K14, K8, ERα staining of five p53 null mammary tumors, A. (a)–(d) T1, (e)–(h) T2, (i)–(l) T4, (m)–(p) T5, (q)–(t) and T7. Scale bar, 50 μm. B. (a, d, g) K8 staining of T1, T3, T6. (b, e, h) K14 staining of T1, T3, T6. (c, f, i) K14, K8, DAPI co-staining of T1, T3, T6. Scale bar, 25 μm.
Figure 2
Figure 2
Flow cytometry analysis provides additional evidence of heterogeneity of p53 null mammary tumors. A. Tumors T1, T2, and T7 were FACS sorted based upon expression of cell surface markers, CD29 and CD24. Dead cells and lineage positive cells were gated out by PI and biotin-conjugated mouse lineage panel kit plus biotin-conjugated CD31 and CD140a. The percentage of individual subpopulations was determined according to isotype control from each assay. * LinCD29HCD24H subpopulation. B. Histograms of T5 were plotted after FACS sorting with red line indicating isotype control, (a) APC-conjugated rat IgG2a, (b) FITC-conjugated rat IgG2a, and (c) R-PE-conjugated rat IgG2a, and blue line representing corresponding antibodies, (a) Lin-APC, (b) CD29-FITC, and (c) CD24-PE. C. FACS sorted LinCD29HCD24H of T8 was collected (a) and re-applied to flow to check the purity of the collected fraction (b).
Figure 3
Figure 3
LinCD29HCD24H subpopulation-generated tumors mimic the parental tumors with respect to their CD29/CD24 profiling as well as histological staining for cytochemical markers. A. Flow plot for tumor T3, T6, and their respective resulting tumors from LinCD29HCD24H fraction. B. Immunostaining of parental tumors T3 (a–d), T6 (I-l) and resulting tumors from (e–h) 500 T3 LinCD29HCD24H cells generated tumor, and (m–p) 500 T6 LinCD29HCD24H cells generated tumor. Scale bar, 100 μm
Figure 4
Figure 4
Mammosphere assay of sorted subpopulations of p53 null mammary tumors. A. Trypsin-digested primary mammospheres from T3 (a) LinCD29HCD24H, (b) LinCD29HCD24L, (c) LinCD29LCD24H, (d) LinCD29LCD24L were re-plated for secondary mammospheres. Pictures were taken on day 7 after plating secondary mammospheres. Scale bar, 250 μm. Scale bar in inserts, 100 μm. B. Plot was generated based on data from Tumors T1, T2, T3, T4, T6, T7, and T10. Two biological, three technical replicates from each tumor. P<0.05, *P<0.06. C. Serial passaged mammospheres (solid line, Tumor T7, passage 10) and collagenase-dissociated tumor T7 cells (spotted line) after grown on plastic for one week were dissociated with trypsin. Viable cells (Eight hundred cells/well in a 96-well plate) were irradiated, 0, 2, 4, or 6 Gy. After two weeks, the colonies were fixed, stained and counted. Relative survival rate were generated using SigmaPlot. Six technical replicates, two biological replicates were applied.
Figure 5
Figure 5
Differentially expressed transcripts in tumor-initiating cells of p53 transplantable mammary tumors. A. Venn diagram of transcripts differentially expressed in LinCD29HCD24H as compared with LinCD29HCD24L, LinCD29L:CD24H, and LinCD29LCD24Lsubpopulations of p53 null transplantable mammary gland tumors (p<0.01 for each comparison). B. The heat map of 710 differentially expressed transcripts in the tumorigenic cancer cell LinCD29HCD24H subpopulation. Each row represents a transcript; each column represents various subpopulation from three tumors. The red color indicates high level expression while blue indicates a low level of expression. The top five IPA picked molecular and cellular functions in which those down- and up-regulated genes involved are indicated on the left (number of molecules).

References

    1. Pardal R, Clarke MF, Morrison SJ. Applying the principles of stem-cell biology to cancer. Nat Rev Cancer. 2003;3:895–902. - PubMed
    1. Huntly BJ, Gilliland DG. Cancer biology: summing up cancer stem cells. Nature. 2005;435:1169–70. - PubMed
    1. Lapidot T, Sirard C, Vormoor J, et al. A cell initiating human acute myeloid leukaemia after transplantation into SCID mice. Nature. 1994;367:645–8. - PubMed
    1. Bonnet D, Dick JE. Human acute myeloid leukemia is organized as a hierarchy that originates from a primitive hematopoietic cell. Nat Med. 1997;3:730–7. - PubMed
    1. Hope KJ, Jin L, Dick JE. Acute myeloid leukemia originates from a hierarchy of leukemic stem cell classes that differ in self-renewal capacity. Nat Immunol. 2004;5:738–43. - PubMed

Publication types

MeSH terms