. 2008 Jun 16;181(6):921-34.
doi: 10.1083/jcb.200710051.

Spatial mapping of splicing factor complexes involved in exon and intron definition

Affiliations

Spatial mapping of splicing factor complexes involved in exon and intron definition

Jonathan D Ellis et al. J Cell Biol. .

Abstract

We have analyzed the interaction between serine/arginine-rich (SR) proteins and splicing components that recognize either the 5' or 3' splice site. Previously, these interactions have been extensively characterized biochemically and are critical for both intron and exon definition. We use fluorescence resonance energy transfer (FRET) microscopy to identify interactions of individual SR proteins with the U1 small nuclear ribonucleoprotein (snRNP)-associated 70-kD protein (U1 70K) and with the small subunit of the U2 snRNP auxiliary factor (U2AF35) in live-cell nuclei. We find that these interactions occur in the presence of RNA polymerase II inhibitors, demonstrating that they are not exclusively cotranscriptional. Using FRET imaging by means of fluorescence lifetime imaging microscopy (FLIM), we map these interactions to specific sites in the nucleus. The FLIM data also reveal a previously unknown interaction between HCC1, a factor related to U2AF65, with both subunits of U2AF. Spatial mapping using FLIM-FRET reveals differences in splicing factors interactions within complexes located in separate subnuclear domains.


Figures
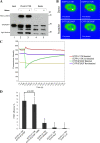
Figure 1.
Figure 1.
U1 70K interacts with SF2/ASF in vitro and in vivo. (A) Cell extracts prepared from 293T cells were incubated with either a mouse monoclonal anti–U1 70K antibody bound to Sepharose beads (lanes 2 and 3) or Sepharose beads alone (lanes 4 and 5). The bound proteins were analyzed by Western blotting with anti-SF2/ASF antibody. Alternatively, the assay was performed in the presence of RNase (lanes 3 and 5). (B) In vivo detection of protein–protein interactions between ECFP-U1 70K and EYFP-SF2/ASF by FRET acceptor photobleaching microscopy. HeLa cells coexpressing ECFP-U1 70K and EYFP-SF2/ASF were analyzed on a wide-field fluorescent microscope. Images were acquired before and after photobleaching. A nonbleached region similar to the bleached region (arrows) was included in the data analysis for comparison. Bars, 15 μm. (C) Donor and acceptor mean fluorescence intensities monitored in the bleached and nonbleached regions were plotted over time. (D) FRET efficiencies for the interaction between ECFP-U1 70K and EYFP-SF2/ASF in the presence and absence of DRB. A FRET efficiency for these interactions was calculated as described in Materials and methods and, when >5%, was considered significant. Plot is of FRET efficiencies ± SD (mean for 8–27 cells) between ECFP + EYFP pairs before and after DRB treatment. P-values were obtained from the two-tailed homoscedastic t test comparing the FRET efficiencies with and without DRB treatment.
Figure 2.
Figure 2.
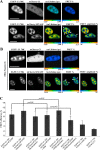
Spatial mapping of the interaction of U1 70K with SF2/ASF in vivo. (A) HeLa cells were transfected with EGFP–U1 70K and cotransfected with either mCherry-C1 or mCherry-SF2/ASF. Shown are confocal images of transfected cells and FLIM images of the same cells, in which mean fluorescence lifetime is shown in pseudocolor. The color scale with the respective lifetimes (in picoseconds [ps]) is indicated. The percentage of FRET efficiencies and FRET amplitude are shown in continuous pseudocolor. The color scale with the respective FRET efficiencies (percentage) is indicated. The FRET amplitude % represents the fraction of interacting donor molecules, also defined as the FRET population % (or concentration of FRET species). (B) FRET between U1 70K and SF2/ASF, in the presence of DRB, measured by FLIM. Experiments were performed exactly as described for A, except cells were treated with 25 μg/ml of DRB for 2 h before images were taken. Bars, 10 μm. (C) FRET efficiencies calculated from FLIM measurements for the interaction of SF2/ASF with U1 70K in the presence and absence of DRB. Plot is of mean FRET efficiencies ± SD for 9–20 cells. To measure the FRET efficiency in the speckles and nucleoplasm, a region characteristic of each was selected for each cell. P-values were obtained as described in the Fig. 1 legend. *, P < 0.1.
Figure 3.
Figure 3.
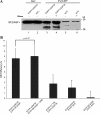
EGFP-U2AF35 interacts with SF2/ASF in cultured mammalian cells. (A) Cell extracts prepared from 293T cells either transiently transfected with EGFP-U2AF35 (lanes 3 and 4) or mock transfected (lanes 5 and 6) were incubated with anti-GFP antibody bound to Sepharose beads. The bound proteins were analyzed by Western blotting with an anti-SF2/ASF antibody. Alternatively, the assay was performed in the presence of RNase (lanes 4 and 6). NTC, nontransfected cells. (B) Effect of DRB on the interaction between ECFP-U2AF35 and EYFP-SF2/ASF. Plot is of FRET efficiencies ± SD (mean for 9–27 cells) between ECFP + EYFP fusion pairs before and after DRB treatment. P-values were obtained as described in the Fig. 1 legend.
Figure 4.
Figure 4.
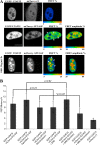
FRET between U2AF35 and SF2/ASF measured by FLIM. (A) HeLa cells were cotransfected with EGFP-U2AF35 and either mCherry-C1 or mCherry-SF2/ASF. Confocal images are of transfected cells and FLIM images of the same cells, in which FRET efficiency and FRET amplitude are shown in pseudocolor. The color scale with the respective efficiency (%) is indicated. Top, EGFP-U2AF35 + mCherry-C1; Middle, EGFP-U2AF35 + mCherry-SF2/ASF; Bottom, EGFP-U2AF35 + mCherry-SF2/ASF in the presence of DRB. Bars, 10 μm. (B) FRET efficiencies determined by FLIM for interaction of SF2/ASF with U2AF35 in the presence and absence of DRB. Plot is of mean FRET efficiencies ± SD for seven to nine cells. To measure the FRET efficiency in the speckles and nucleoplasm, a region characteristic of each was selected for each cell. P-values were obtained as described in the Fig. 1 legend. *, P < 0.1.
Figure 5.
Figure 5.
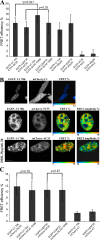
SRp20 and SC35 interact with U1 70K and U2AF35. (A) Plot of FRET efficiencies ± SD (mean for 7–14 cells) between ECFP and EYFP fusion proteins measured by FRET acceptor photobleaching. P-values were obtained from the t test comparing the FRET efficiencies with and without DRB treatment. (B) FRET between U1 70K and SC35 measured by FLIM. HeLa cells were transfected with EGFP-U1 70K and cotransfected with either mCherry-C1 or mCherry-SC35. Confocal images are of transfected cells and FLIM images are of the same cells, in which FRET efficiency and FRET amplitude are shown in pseudocolor. The color scale with the respective efficiency (%) is indicated. Top, EGFP-U1 70K + mCherry-C1; Middle, EGFP-U1 70K + mCherry-SC35; Bottom, EGFP-U1 70K + mCherry-SC35 in the presence of DRB. Arrowheads indicate high FRET within the nucleoplasm. Bars, 10 μm. (C) FRET efficiencies determined by FLIM for interaction of SC35 with U1 70K and U2AF35 in the presence and absence of DRB. Plot is of mean FRET efficiencies ± SD for 8–11 cells. P-values were obtained as described in A.
Figure 6.
Figure 6.
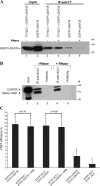
HCC1 interacts with both subunits of the U2AF heterodimer in vitro and in vivo. (A) Extracts prepared from 293T cells transiently transfected with either EGFP-U2AF35 and pCG-T7-HCC1.4 (lanes 3 and 4) or EGFP-U2AF35 (lanes 5 and 6) were incubated with anti-T7 antibody bound to Sepharose beads. The bound proteins were analyzed by Western blotting with anti-GFP antibody. Alternatively, the assay was performed in the presence of RNase (lanes 4 and 6). (B) U2AF65 interacts with HCC1 in cultured mammalian cells. Extracts prepared from 293T were incubated with either anti-HCC1 antibody bound to Sepharose beads (lanes 2 and 4) or Sepharose beads alone (lanes 3 and 5). The bound proteins were analyzed by Western blotting with anti-U2AF65 antibody. Alternatively, the immunoprecipitate was treated with RNase (lanes 4 and 5). (C) Effect of DRB on interactions of HCC1 with U2AF35 and U2AF65. Plot is of FRET efficiencies ± SD (mean for 8–18 cells) between ECFP and EYFP fusion proteins measured by FRET acceptor photobleaching. P-values were obtained as described in the Fig. 5 legend.
Figure 7.
Figure 7.
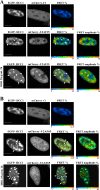
FRET between HCC1 and both subunits of the U2AF heterodimer measured by FLIM. (A) HeLa cells were cotransfected with EGFP-HCC1 and either mCherry-C1 or mCherry-U2AF35. Confocal images are of transfected cells and FLIM images are of the same cells. The color scale with the respective efficiency (%) is indicated. The FRET efficiencies are shown in continuous pseudocolor. Top, EGFP-HCC1 + mCherry-C1; Middle, EGFP-HCC1 + mCherry-U2AF35; Bottom, EGFP-HCC1 + mCherry-U2AF35 in the presence of DRB. Arrows indicate high FRET within the nucleoplasm and arrowheads indicate nuclear speckles. (B) FRET between HCC1 and U2AF65 measured by FLIM. HeLa cells were transfected with EGFP-HCC1 and cotransfected with either mCherry-C1 or mCherry-U2AF65. Confocal images are of transfected cells and FLIM images are of same cells, in which the percentage of FRET Efficiency and FRET amplitude are shown in pseudocolor. The color scale with the respective efficiency (%) is indicated. Top, EGFP-HCC1 + mCherry-C1; Middle, EGFP-HCC1 + mCherry-U2AF65; Bottom, EGFP-HCC1 + mCherry-U2AF65 in the presence of DRB. Arrowheads indicate high FRET within the nucleoplasm and arrowheads indicate nuclear speckles. Bars, 10 μm.

Similar articles

Cited by

References

    1. Blencowe, B.J., J.A. Bowman, S. McCracken, and E. Rosonina. 1999. SR-related proteins and the processing of messenger RNA precursors. Biochem. Cell Biol. 77:277–291. - PubMed
    1. Caceres, J.F., S. Stamm, D.M. Helfman, and A.R. Krainer. 1994. Regulation of alternative splicing in vivo by overexpression of antagonistic splicing factors. Science. 265:1706–1709. - PubMed
    1. Caceres, J.F., T. Misteli, G.R. Screaton, D.L. Spector, and A.R. Krainer. 1997. Role of the modular domains of SR proteins in subnuclear localization and alternative splicing specificity. J. Cell Biol. 138:225–238. - PMC - PubMed
    1. Caceres, J.F., G.R. Screaton, and A.R. Krainer. 1998. A specific subset of SR proteins shuttles continuously between the nucleus and the cytoplasm. Genes Dev. 12:55–66. - PMC - PubMed
    1. Cazalla, D., K. Newton, and J.F. Caceres. 2005. A novel SR-related protein is required for the second Step of pre-mRNA splicing. Mol. Cell. Biol. 25:2969–2980. - PMC - PubMed

Publication types