. 2008 Jun 16;181(6):945-57.
doi: 10.1083/jcb.200706152.

Cytokine secretion requires phosphatidylcholine synthesis

Affiliations

Cytokine secretion requires phosphatidylcholine synthesis

Yong Tian et al. J Cell Biol. .

Abstract

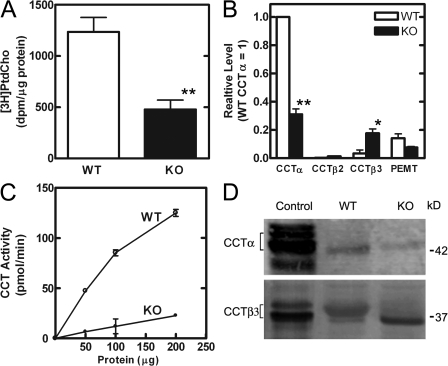
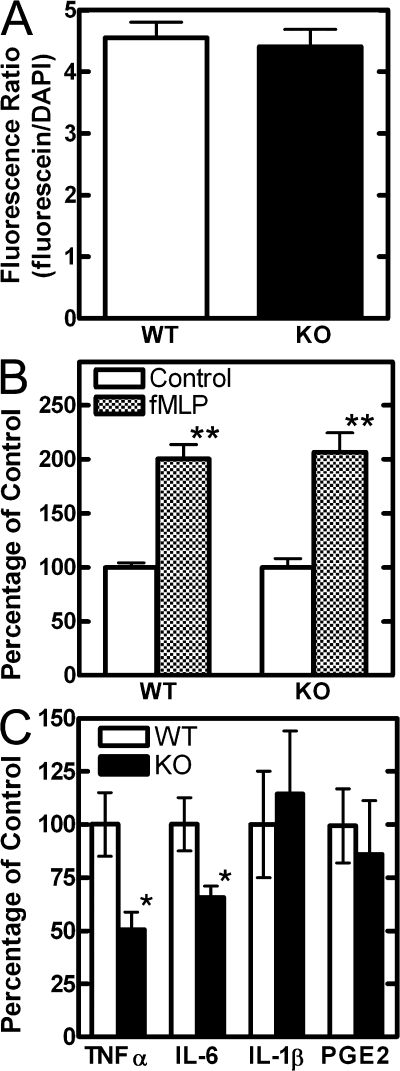
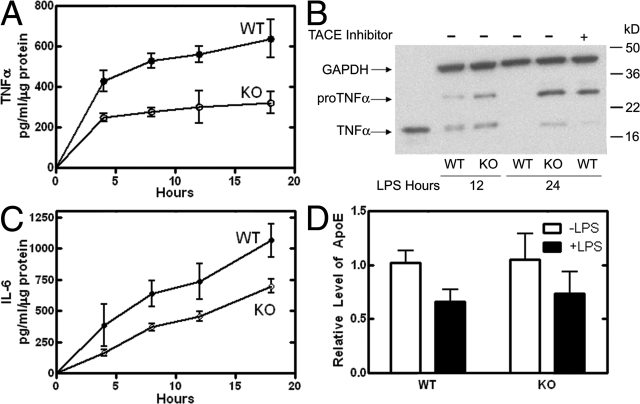
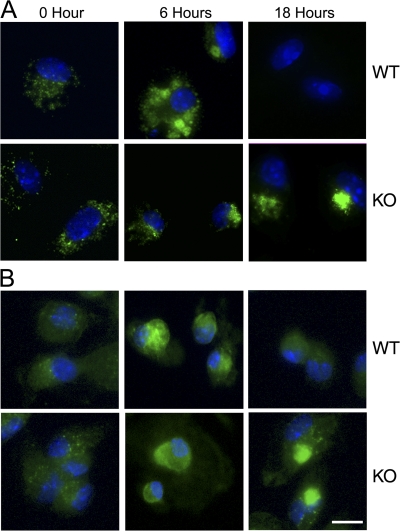
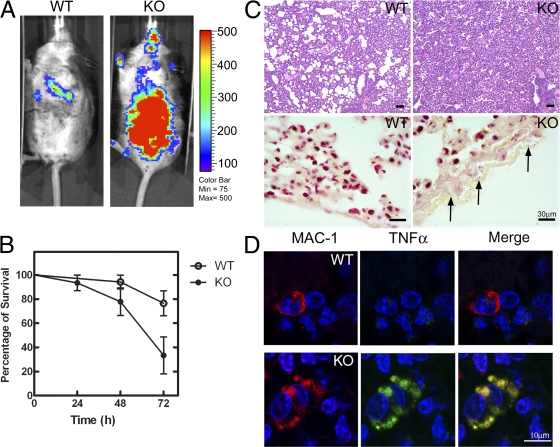
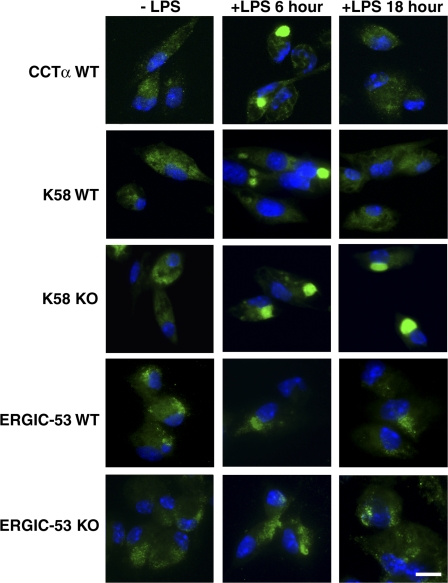
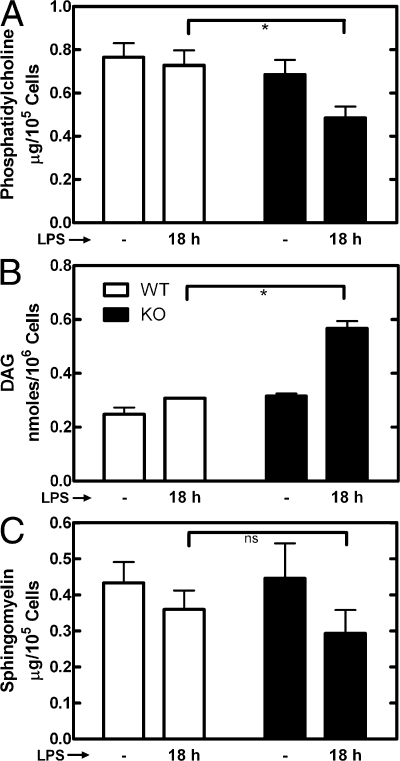
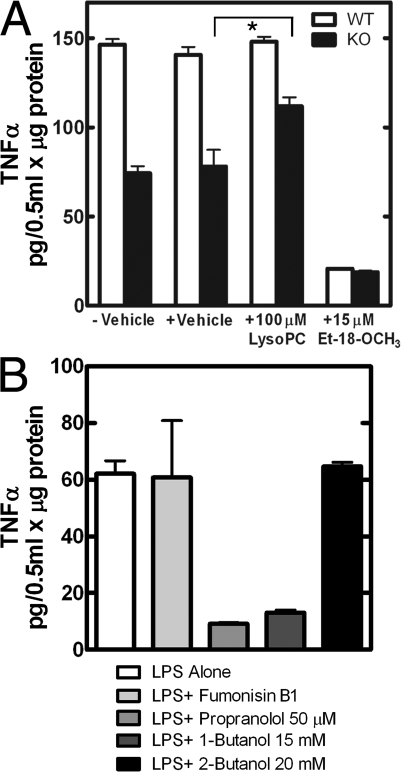
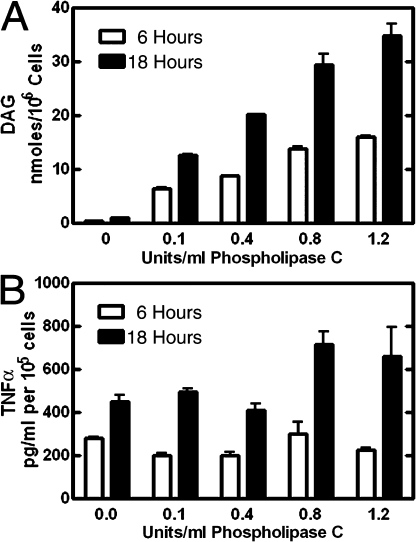
Choline cytidylyltransferase (CCT) is the rate-limiting enzyme in the phosphatidylcholine biosynthetic pathway. Here, we demonstrate that CCT alpha-mediated phosphatidylcholine synthesis is required to maintain normal Golgi structure and function as well as cytokine secretion from the Golgi complex. CCT alpha is localized to the trans-Golgi region and its expression is increased in lipopolysaccharide (LPS)-stimulated wild-type macrophages. Although LPS triggers transient reorganization of Golgi morphology in wild-type macrophages, similar structural alterations persist in CCT alpha-deficient cells. Pro-tumor necrosis factor alpha and interleukin-6 remain lodged in the secretory compartment of CCT alpha-deficient macrophages after LPS stimulation. However, the lysosomal-mediated secretion pathways for interleukin-1 beta secretion and constitutive apolipoprotein E secretion are unaltered. Exogenous lysophosphatidylcholine restores LPS-stimulated secretion from CCT alpha-deficient cells, and elevated diacylglycerol levels alone do not impede secretion of pro-tumor necrosis factor alpha or interleukin-6. These results identify CCT alpha as a key component in membrane biogenesis during LPS-stimulated cytokine secretion from the Golgi complex.


Figures

Figure 1.
Figure 1.
Reduced PtdCho synthesis in CCTα-deficient macrophages. (A) Wild-type (WT; n = 12) or CCTα-deficient (KO; n = 12) macrophages were labeled for 6 h with 1 μCi/ml [3H]choline, and incorporation into PtdCho was normalized to cellular protein. (B) Relative transcript levels for CCTα, CCTβ2, CCTβ3, or PEMT were determined by real-time qRT-PCR in wild-type (n = 3) or CCTα-deficient (n = 3) macrophages. (C) CCT enzyme activity in wild-type (○; n = 4) or CCTα-deficient (•; n = 4) macrophage lysates was determined in vitro as a function of protein concentration. (D) Protein expression levels of CCTα (42 kD) and CCTβ3 (39 kD) were determined in wild-type and CCTα-deficient macrophage lysates (50 μg) by immunoblotting with isoform-specific antibodies. Immunoblots are representative of macrophages from two mice of each genotype. Cells (HEK293T) transfected with expression plasmids encoding CCTα or CCTβ3 were lysed, and 5 μg of protein was loaded as a positive control. Multiple immunopositive bands in a lane correspond to different phosphorylation states of the CCT protein (Jackowski, 1994; Lykidis et al., 1998). Error bars indicate mean ± SE. *, P < 0.05; **, P < 0.01.
Figure 2.
Figure 2.
Functional comparison of wild-type and CCTα-deficient macrophages. (A) Phagocytosis of fluorescein-labeled E. coli was quantified after 2 h of incubation and then normalized to the cell number by staining with DAPI as described in Materials and methods (n = 8). (B) Chemotaxis was measured by migration of wild-type (WT; n = 8) or CCTα-deficient (KO; n = 16) macrophages in modified Boyden chambers after 4 h of incubation with either LCM or LCM plus n-fMLP. The numbers of cells in the target chambers were determined by staining with Calcein AM, quantification of the fluorescent signal, and comparison with a calibration curve of increasing cell number. (C) Cytokine and PGE2 secretion from wild-type (white; n = 8) and CCTα-deficient (black; n = 8) macrophages 18 h after LPS stimulation was measured with the Luminex assay (BioRad Laboratories) or by individual ELISA assays and normalized to protein content in each sample. The mean values for cytokines in the medium from WT cells were: TNFα, 319.3 pg/μg cell protein; IL-6, 266.2 pg/μg cell protein; IL-1β, 15.3 pg/μg cell protein; and PGE2, 5.46 pg/μg cell protein. Error bars indicate mean ± SE. *, P < 0.05; **, P < 0.01.
Figure 3.
Figure 3.
Secretion and processing of TNFα. (A) TNFα in the culture medium from wild-type (○; n = 5) or CCTα-deficient (•; n = 10) macrophages was measured at indicated times after LPS stimulation. The anti-TNFα antibody used in the ELISA recognized both the pro-TNFα and mature TNFα. (B) Synthesis and processing of TNFα was evaluated by immunoblotting cell lysates from wild-type (WT) or CCTα-deficient (KO) macrophages. Cells were treated with LPS for either 12 or 24 h, or with an inhibitor of TACE, TAPI, which was added to selected cultures to confirm the identification of the unprocessed pro-TNFα. Purified recombinant mouse TNFα (Leinco Technologies, Inc.) was a positive control (lane 1), and anti-GAPDH mAb (Ambion) was used to confirm equal protein loading (50 μg) in each lane. The data are representative of three independent experiments. (C) IL-6 in the culture medium from the same macrophages used in A. (D) Apo E secretion was evaluated by immunoblotting the culture medium from wild-type or CCTα-deficient macrophages incubated for 18 h with and without LPS. Equal volumes of the culture medium were loaded onto the gel, and the immunoblot densities were quantified. The data are the mean ± SE from two independent determinations using macrophages from a total of four mice of each genotype.
Figure 4.
Figure 4.
TNFα and IL-6 accumulation in the CCTα-deficient macrophages. (A) Wild-type (WT) or CCTα-deficient (KO) macrophages were treated with LPS, fixed, and stained with anti-TNFα antibody (green) at 0, 6, or 18 h. (B) Wild-type or CCTα-deficient macrophages were treated with LPS and stained with anti–IL-6 antibody (green) at 0, 6, or 18 h. Cell nuclei in A and B were counterstained with DAPI (blue). At least 100 cells were visualized in each of two independent experiments. Bar, 10 μm.
Figure 5.
Figure 5.
Aberrant cytokine release from CCTα-deficient macrophages after bacterial infection. (A) Distribution of S. pneumoniae LUX at 3 d after intranasal challenge. Bacterial numbers are proportional to the color bar on the right. Note the small focus of bacteria in lungs of the wild-type (WT) mouse versus systemic bacteremia in the knockout (KO) mouse. Images are representative of the mice from three independent experiments. (B) Survival of mice with wild-type (○; n = 16) or CCTα-deficient (•; n = 16) macrophages after bacterial challenge. The results were compiled from three independent experiments. Error bars indicate mean ± SE. (C) Lung pathology at 3 d after infection. Hematoxylin and eosin staining (top) illustrates more severe pneumonia and Gram's staining (bottom) illustrates increased bacterial proliferation (arrows) with CCTα-null macrophages. Bars, 30 μm. (D) 10-μm-thick frozen sections obtained from mouse lung tissue. Infiltrating macrophages 48 h after infection were identified by positive MAC-1 staining (red) and TNFα staining (green), and cells were counterstained with DAPI (blue). MAC-1–positive signals, 11–15 per 40× field, from alveolar and interstitial macrophages were examined using three slides from each infected lung in three individual mice of each genotype. In lungs from animals with wild-type macrophages, a mean of 18% MAC-1–positive cells were TNFα positive, and with CCTα-null macrophages, a mean of 82% MAC-1–positive cells were TNFα positive. Cell nuclei are indicated as DAPI-positive (blue).
Figure 6.
Figure 6.
Distributions of Golgi markers in LPS-treated macrophages. Wild-type (WT) and knockout (KO) peritoneal macrophages were treated with LPS at 10 ng/ml for 0, 6, and 18 h. After immediate fixation in 4% paraformaldehyde, cells were permeabilized and stained with antibodies against CCTα (green), the trans-Golgi marker K58 (green), or the cis-Golgi marker ERGIC-53 (green). Cell nuclei were counterstained with DAPI (blue). Each micrograph shown in the figure is representative of macrophages from at least four independent mice. Bar, 15 μm.
Figure 7.
Figure 7.
Amounts of PtdCho, DAG, and SM after LPS stimulation. Wild-type (WT; white) and CCTα-deficient (KO; black) macrophages were incubated with 10 ng/ml LPS or without LPS for 18 h, and total lipids were extracted. The identification of PtdCho (A) and SM (C) was determined by TLC and comigration with authentic standards, and the amount of each lipid was quantified by flame ionization using the Iatroscan calibrated with known amounts of each standard. The amount of DAG (B) was determined by the DAG kinase assay. Values were normalized to cell numbers. Data are the mean of determinations from at least two individual mice of each genotype. Error bars indicate mean ± SE. ns, not significant; *, P < 0.05.
Figure 8.
Figure 8.
Cycle of PtdCho degradation and resynthesis associated with secretion from the Golgi apparatus. PtdCho is degraded by a PLD1 to PtdOH, which in turn is converted to DAG by a PtdOH P'tse during secretion from the trans-Golgi compartment. The C/EPT utilizes DAG and CDP–Cho to form PtdCho and replenish the Golgi-associated PtdCho pool.
Figure 9.
Figure 9.
Response of TNFα secretion to different treatments. (A) Wild-type (WT; white bars) or CCTα-deficient (KO; black bars) macrophages were treated with 10 ng/ml LPS for 18 h. At the same time, 100 μM LysoPC, 15 μM edelfosine, or solvent vehicle (0.1% ethanol) were added to the medium as indicated. The amount of TNFα secreted into the culture medium was determined using a Quantikine kit, and results are the mean values normalized to cellular protein (n = 8) obtained from four mice of each genotype. (B) Wild-type cells were treated with 10 ng/ml LPS alone, with LPS plus 10 μM fumonisin B1 to inhibit ceramide synthesis, with LPS plus 50 μM propranolol to inhibit the PtdOH P'tse, with LPS plus 15 mM 1-butanol to inhibit the phospholipase D, and with LPS plus 20 mM 2-butanol as an alcohol control for 8 h. Data are the mean of determinations from four individual mice of each genotype. Error bars indicate mean ± SE. *, P < 0.05.
Figure 10.
Figure 10.
Cell-associated DAG and TNFα release to the medium after LPS and exogenous phospholipase C. Wild-type macrophages were treated with LPS for 3 h, then B. cereus phospholipase C was added at the indicated concentrations for the remainder of the 6- and 18-h incubations. (A) Cells were harvested for lipid extraction, and the amount of DAG was determined by the DAG kinase assay as described in Materials and methods. The values were normalized to cell numbers. (B) TNFα was quantified in the medium using the ELISA method. The values were normalized to cell number. The data are the mean of values obtained using cells from three mice. Error bars indicate mean ± SE.

References

    1. Altan-Bonnet, N., R. Sougrat, and J. Lippincott-Schwartz. 2004. Molecular basis for Golgi maintenance and biogenesis. Curr. Opin. Cell Biol. 16:364–372. - PubMed
    1. Altan-Bonnet, N., R. Sougrat, W. Liu, E.L. Snapp, T. Ward, and J. Lippincott-Schwartz. 2006. Golgi inheritance in mammalian cells is mediated through endoplasmic reticulum export activities. Mol. Biol. Cell. 17:990–1005. - PMC - PubMed
    1. Andrei, C., P. Margiocco, A. Poggi, L.V. Lotti, M.R. Torrisi, and A. Rubartelli. 2004. Phospholipases C and A2 control lysosome-mediated IL-1β secretion: Implications for inflammatory processes. Proc. Natl. Acad. Sci. USA. 101:9745–9750. - PMC - PubMed
    1. Attard, G.S., R.H. Templer, W.S. Smith, A.N. Hunt, and S. Jackowski. 2000. Modulation of CTP:phosphocholine cytidylyltransferase by membrane curvature elastic stress. Proc. Natl. Acad. Sci. USA. 97:9032–9036. - PMC - PubMed
    1. Baburina, I., and S. Jackowski. 1998. Apoptosis triggered by 1-O-Octadecyl-2-O-methyl-rac-glycero-3-phosphocholine is prevented by increased expression of CTP:phosphocholine cytidylyltransferase. J. Biol. Chem. 273:2169–2173. - PubMed

Publication types

MeSH terms