. 2008 Jul 1;149(1):1-10.
doi: 10.7326/0003-4819-149-1-200807010-00231. Epub 2008 Jun 16.

Diabetes and hearing impairment in the United States: audiometric evidence from the National Health and Nutrition Examination Survey, 1999 to 2004

Affiliations

Diabetes and hearing impairment in the United States: audiometric evidence from the National Health and Nutrition Examination Survey, 1999 to 2004

Kathleen E Bainbridge et al. Ann Intern Med. .

Abstract

Background: Diabetes might affect the vasculature and neural system of the inner ear, leading to hearing impairment.

Objective: To determine whether hearing impairment is more prevalent among U.S. adults with diabetes.

Design: Cross-sectional analysis of nationally representative data.

Setting: National Health and Nutrition Examination Survey, 1999 to 2004.

Participants: 5140 noninstitutionalized adults age 20 to 69 years who had audiometric testing.

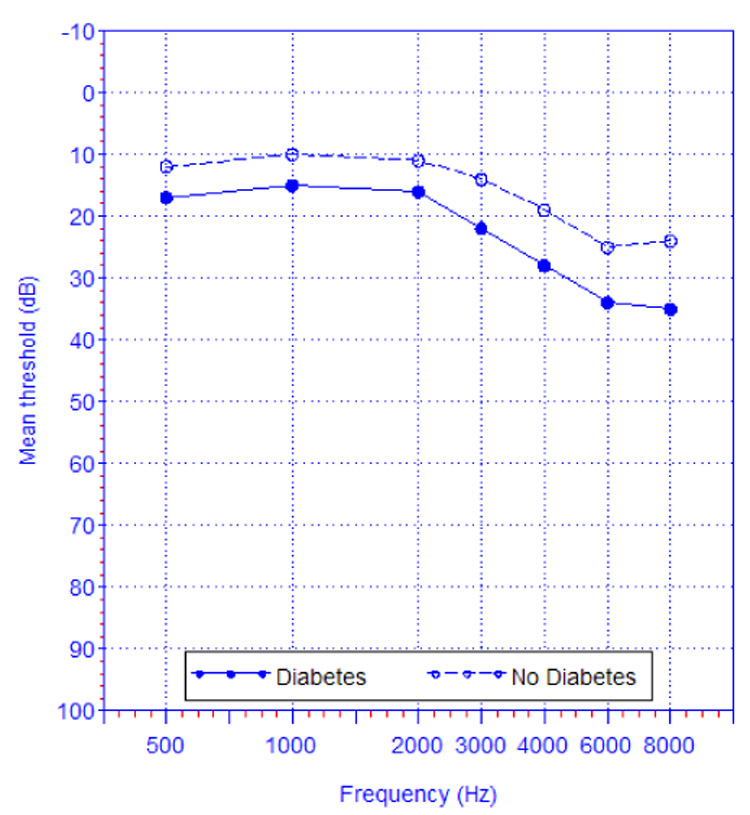
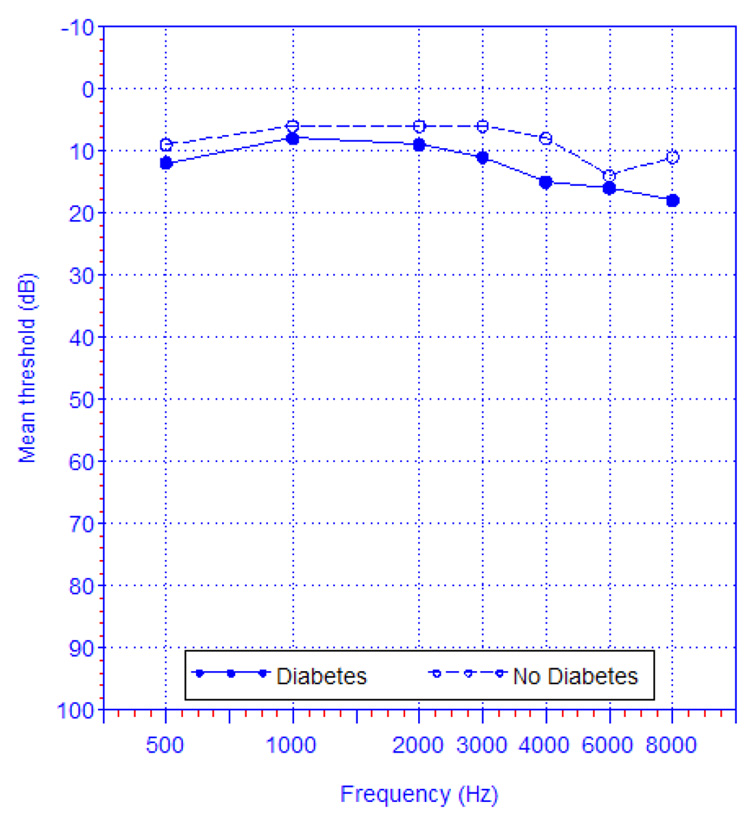
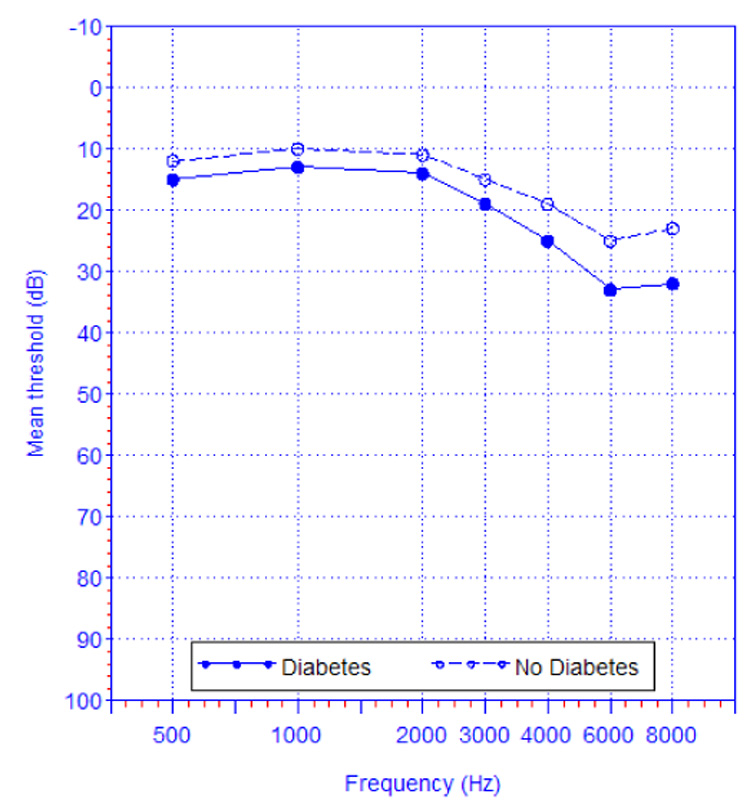
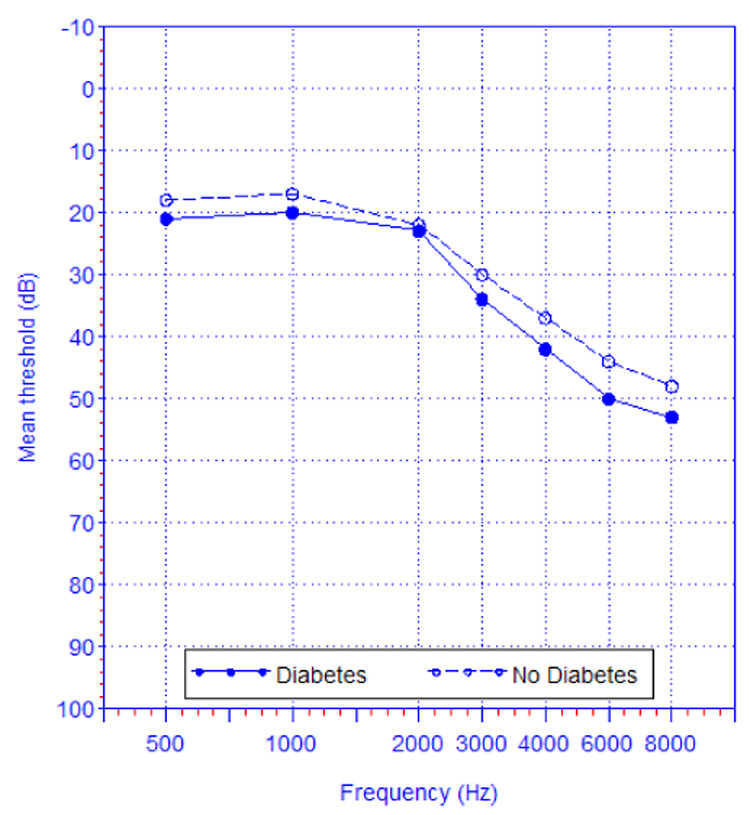
Measurements: Hearing impairment was assessed from the pure tone average of thresholds over low or mid-frequencies (500, 1000, and 2000 Hz) and high frequencies (3000, 4000, 6000, and 8000 Hz) and was defined as mild or greater severity (pure tone average >25 decibels hearing level [dB HL]) and moderate or greater severity (pure tone average >40 dB HL).

Results: Hearing impairment was more prevalent among adults with diabetes. Age-adjusted prevalence of low- or mid-frequency hearing impairment of mild or greater severity in the worse ear was 21.3% (95% CI, 15.0% to 27.5%) among 399 adults with diabetes compared with 9.4% (CI, 8.2% to 10.5%) among 4741 adults without diabetes. Similarly, age-adjusted prevalence of high-frequency hearing impairment of mild or greater severity in the worse ear was 54.1% (CI, 45.9% to 62.3%) among those with diabetes compared with 32.0% (CI, 30.5% to 33.5%) among those without diabetes. The association between diabetes and hearing impairment was independent of known risk factors for hearing impairment, such as noise exposure, ototoxic medication use, and smoking (adjusted odds ratios for low- or mid-frequency and high-frequency hearing impairment were 1.82 [CI, 1.27 to 2.60] and 2.16 [CI, 1.47 to 3.18], respectively).

Limitations: The diagnosis of diabetes was based on self-report. The investigators could not distinguish between type 1 and type 2 diabetes. Noise exposure was based on participant recall.

Conclusion: Hearing impairment is common in adults with diabetes, and diabetes seems to be an independent risk factor for the condition.


Figures

Figure 1
Figure 1
Figure 1a. Mean of the within-person pure tone thresholds (averaged over both ears) by diagnosed diabetes status, among U.S. adults age 20–69 years, age-adjusted to the 2000 US Census,—NHANES 1999–2004 (n=5140). Figure 1b. Mean of the within-person pure tone thresholds (averaged over both ears) by diagnosed diabetes status, among U.S. adults age 20–29 years*,—NHANES 1999–2004 (n=1209). * Curve representing persons with diabetes is based on n=10 and should be interpreted with caution. Figure 1c. Mean of the within-person pure tone thresholds (averaged over both ears) by diagnosed diabetes status, among U.S. adults age 30–39 years, —NHANES 1999–2004 (n=1084). Figure 1d. Mean of the within-person pure tone thresholds (averaged over both ears) by diagnosed diabetes status, among U.S. adults age 40–49 years, —NHANES 1999–2004 (n=1036). Figure 1e. Mean of the within-person pure tone thresholds (averaged over both ears) by diagnosed diabetes status, among U.S. adults age 50–59 years, —NHANES 1999–2004 (n=838). Figure 1f. Mean of the within-person pure tone thresholds (averaged over both ears) by diagnosed diabetes status, among U.S. adults age 60–69 years, —NHANES 1999–2004 (n=973).
Figure 1
Figure 1
Figure 1a. Mean of the within-person pure tone thresholds (averaged over both ears) by diagnosed diabetes status, among U.S. adults age 20–69 years, age-adjusted to the 2000 US Census,—NHANES 1999–2004 (n=5140). Figure 1b. Mean of the within-person pure tone thresholds (averaged over both ears) by diagnosed diabetes status, among U.S. adults age 20–29 years*,—NHANES 1999–2004 (n=1209). * Curve representing persons with diabetes is based on n=10 and should be interpreted with caution. Figure 1c. Mean of the within-person pure tone thresholds (averaged over both ears) by diagnosed diabetes status, among U.S. adults age 30–39 years, —NHANES 1999–2004 (n=1084). Figure 1d. Mean of the within-person pure tone thresholds (averaged over both ears) by diagnosed diabetes status, among U.S. adults age 40–49 years, —NHANES 1999–2004 (n=1036). Figure 1e. Mean of the within-person pure tone thresholds (averaged over both ears) by diagnosed diabetes status, among U.S. adults age 50–59 years, —NHANES 1999–2004 (n=838). Figure 1f. Mean of the within-person pure tone thresholds (averaged over both ears) by diagnosed diabetes status, among U.S. adults age 60–69 years, —NHANES 1999–2004 (n=973).

Comment in

Summary for patients in

Similar articles

Cited by

References

    1. Pleis JR, Lethbridge-Cejku M. Summary health statistics for U.S. adults: National Health Interview Survey 2005. Vital Health Stat 10. 2006;(232):1–153. - PubMed
    1. Cruickshanks KJ, Tweed TS, Wiley TL, et al. The 5-year incidence and progression of hearing loss: the epidemiology of hearing loss study. Arch Otolaryngol Head Neck Surg. 2003;129(10):1041–1046. - PubMed
    1. Muhr P, Mansson B, Hellstrom PA. A study of hearing changes among military conscripts in the Swedish Army. Int J Audiol. 2006;45(4):247–251. - PubMed
    1. Dalton DS, Cruickshanks KJ, Wiley TL, Klein BE, Klein R, Tweed TS. Association of leisure-time noise exposure and hearing loss. Audiology. 2001;40(1):1–9. - PubMed
    1. Cruickshanks KJ, Klein R, Klein BE, Wiley TL, Nondahl DM, Tweed TS. Cigarette smoking and hearing loss: the epidemiology of hearing loss study. Jama. 1998;279(21):1715–1719. - PubMed

Publication types