

Initiation and execution of lipotoxic ER stress in pancreatic beta-cells
- PMID: 18559892
- PMCID: PMC3675788
- DOI: 10.1242/jcs.026062
Initiation and execution of lipotoxic ER stress in pancreatic beta-cells
Abstract
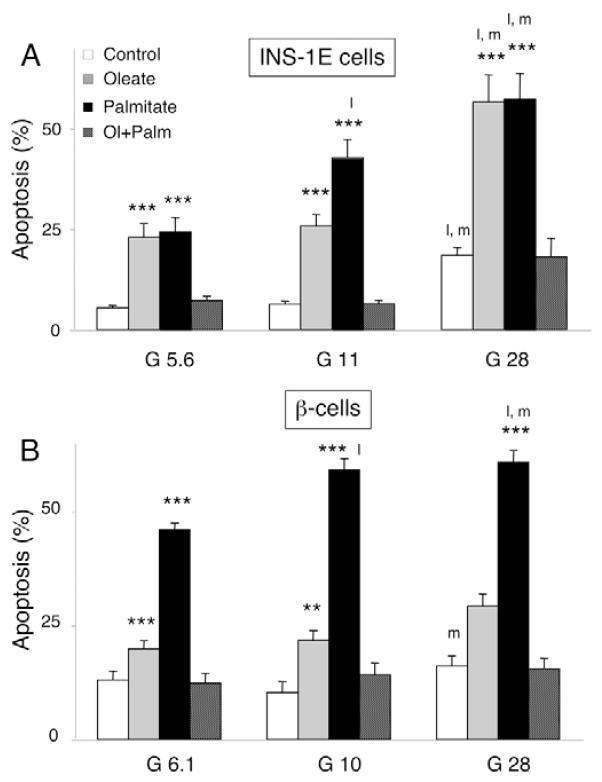
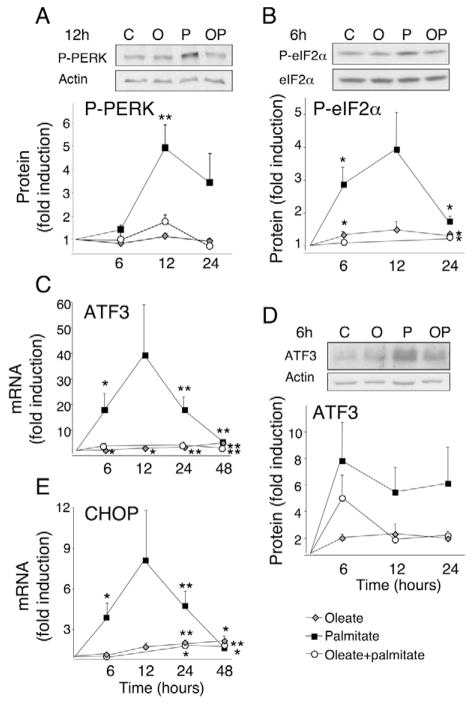
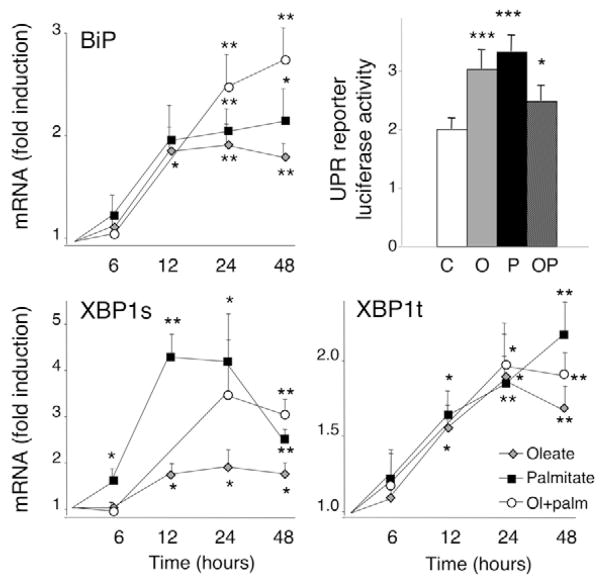
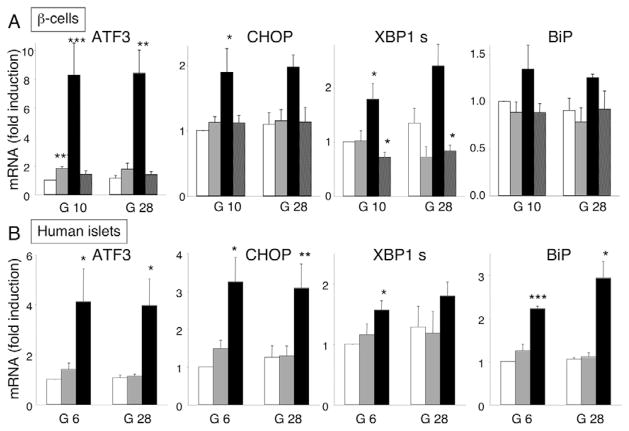
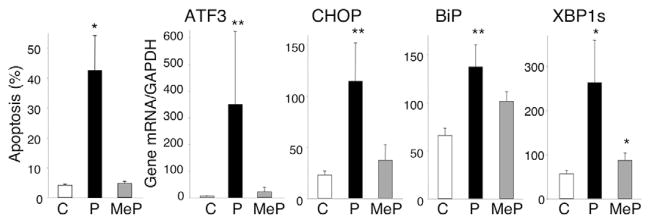
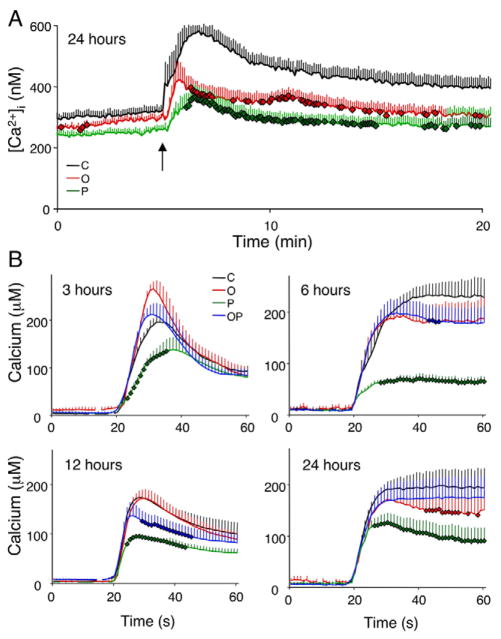
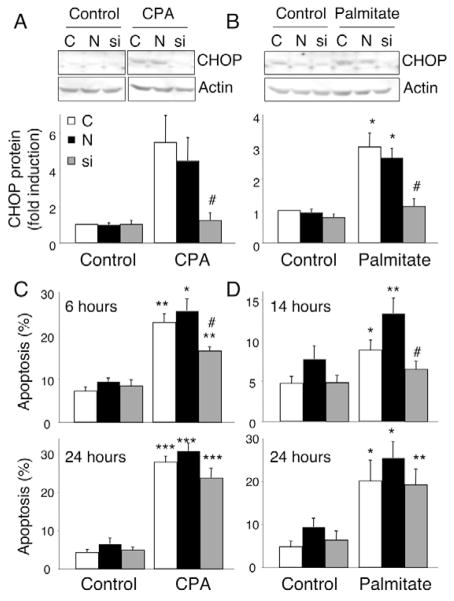
Free fatty acids (FFA) cause apoptosis of pancreatic beta-cells and might contribute to beta-cell loss in type 2 diabetes via the induction of endoplasmic reticulum (ER) stress. We studied here the molecular mechanisms implicated in FFA-induced ER stress initiation and apoptosis in INS-1E cells, FACS-purified primary beta-cells and human islets exposed to oleate and/or palmitate. Treatment with saturated and/or unsaturated FFA led to differential ER stress signaling. Palmitate induced more apoptosis and markedly activated the IRE1, PERK and ATF6 pathways, owing to a sustained depletion of ER Ca(2+) stores, whereas the unsaturated FFA oleate led to milder PERK and IRE1 activation and comparable ATF6 signaling. Non-metabolizable methyl-FFA analogs induced neither ER stress nor beta-cell apoptosis. The FFA-induced ER stress response was not modified by high glucose concentrations, suggesting that ER stress in primary beta-cells is primarily lipotoxic, and not glucolipotoxic. Palmitate, but not oleate, activated JNK. JNK inhibitors reduced palmitate-mediated AP-1 activation and apoptosis. Blocking the transcription factor CHOP delayed palmitate-induced beta-cell apoptosis. In conclusion, saturated FFA induce ER stress via ER Ca(2+) depletion. The IRE1 and resulting JNK activation contribute to beta-cell apoptosis. PERK activation by palmitate also contributes to beta-cell apoptosis via CHOP.
Figures


Similar articles
-
Oleate rescues INS-1E β-cells from palmitate-induced apoptosis by preventing activation of the unfolded protein response.Biochem Biophys Res Commun. 2013 Nov 29;441(4):770-6. doi: 10.1016/j.bbrc.2013.10.130. Epub 2013 Nov 1. Biochem Biophys Res Commun. 2013. PMID: 24189472
-
Cytokine-induced beta-cell death is independent of endoplasmic reticulum stress signaling.Diabetes. 2008 Nov;57(11):3034-44. doi: 10.2337/db07-1802. Epub 2008 Jun 30. Diabetes. 2008. PMID: 18591394 Free PMC article.
-
Pathological endoplasmic reticulum stress mediated by the IRE1 pathway contributes to pre-insulitic beta cell apoptosis in a virus-induced rat model of type 1 diabetes.Diabetologia. 2013 Dec;56(12):2638-46. doi: 10.1007/s00125-013-3044-4. Diabetologia. 2013. PMID: 24121653 Free PMC article.
-
Causes and cures for endoplasmic reticulum stress in lipotoxic β-cell dysfunction.Diabetes Obes Metab. 2010 Oct;12 Suppl 2:76-82. doi: 10.1111/j.1463-1326.2010.01279.x. Diabetes Obes Metab. 2010. PMID: 21029303 Review.
-
Molecular signal networks and regulating mechanisms of the unfolded protein response.J Zhejiang Univ Sci B. 2017 Jan.;18(1):1-14. doi: 10.1631/jzus.B1600043. J Zhejiang Univ Sci B. 2017. PMID: 28070992 Free PMC article. Review.
Cited by
-
Recent Insights Into Mechanisms of β-Cell Lipo- and Glucolipotoxicity in Type 2 Diabetes.J Mol Biol. 2020 Mar 6;432(5):1514-1534. doi: 10.1016/j.jmb.2019.09.016. Epub 2019 Oct 16. J Mol Biol. 2020. PMID: 31628942 Free PMC article. Review.
-
ER Stress and the UPR in Shaping Intestinal Tissue Homeostasis and Immunity.Front Immunol. 2019 Dec 4;10:2825. doi: 10.3389/fimmu.2019.02825. eCollection 2019. Front Immunol. 2019. PMID: 31867005 Free PMC article. Review.
-
Triglyceride to High-Density Lipoprotein Cholesterol (TG/HDL-C) Ratio, a Simple but Effective Indicator in Predicting Type 2 Diabetes Mellitus in Older Adults.Front Endocrinol (Lausanne). 2022 Feb 24;13:828581. doi: 10.3389/fendo.2022.828581. eCollection 2022. Front Endocrinol (Lausanne). 2022. PMID: 35282431 Free PMC article.
-
Perilipin5 protects against lipotoxicity and alleviates endoplasmic reticulum stress in pancreatic β-cells.Nutr Metab (Lond). 2019 Jul 30;16:50. doi: 10.1186/s12986-019-0375-2. eCollection 2019. Nutr Metab (Lond). 2019. PMID: 31384284 Free PMC article.
-
Molecular Mechanism of Lipotoxicity as an Interesting Aspect in the Development of Pathological States-Current View of Knowledge.Cells. 2022 Mar 1;11(5):844. doi: 10.3390/cells11050844. Cells. 2022. PMID: 35269467 Free PMC article. Review.
References
-
- Asfari M, Janjic D, Meda P, Li G, Halban PA, Wollheim CB. Establishment of 2-mercaptoethanol-dependent differentiated insulin-secreting cell lines. Endocrinology. 1992;130:167–178. - PubMed
-
- Benavides A, Pastor D, Santos P, Tranque P, Calvo S. CHOP plays a pivotal role in the astrocyte death induced by oxygen and glucose deprivation. Glia. 2005;52:261–275. - PubMed
-
- Bonny C, Oberson A, Negri S, Sauser C, Schorderet DF. Cell-permeable peptide inhibitors of JNK: novel blockers of β-cell death. Diabetes. 2001;50:77–82. - PubMed
-
- Borradaile NM, Han X, Harp JD, Gale SE, Ory DS, Schaffer JE. Disruption of endoplasmic reticulum structure and integrity in lipotoxic cell death. J Lipid Res. 2006;47:2726–2737. - PubMed
Publication types
MeSH terms
Substances
Grants and funding
LinkOut - more resources
Full Text Sources
Other Literature Sources
Molecular Biology Databases
Research Materials
Miscellaneous
