. 2008 Sep 1;112(5):1981-92.
doi: 10.1182/blood-2007-07-103010. Epub 2008 Jun 17.

Id1 is a common downstream target of oncogenic tyrosine kinases in leukemic cells

Affiliations

Id1 is a common downstream target of oncogenic tyrosine kinases in leukemic cells

Winnie F Tam et al. Blood. .

Abstract

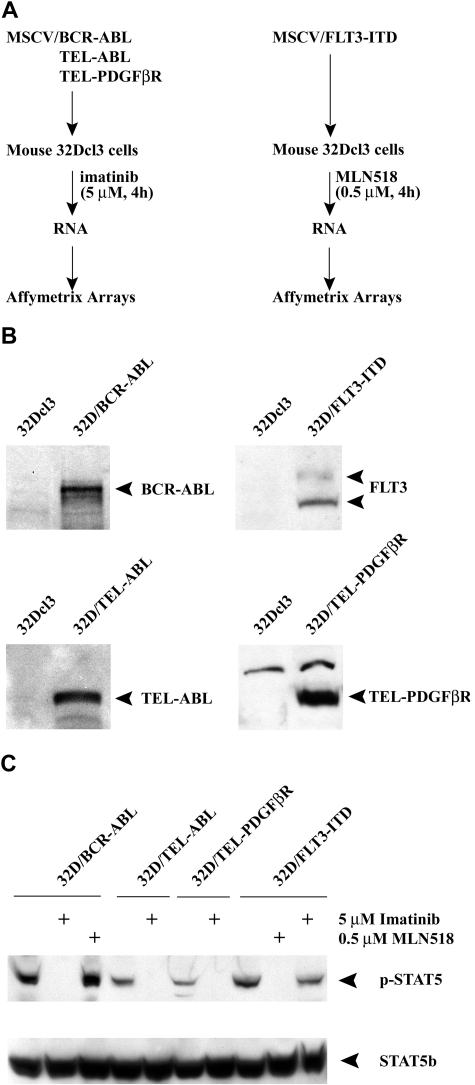
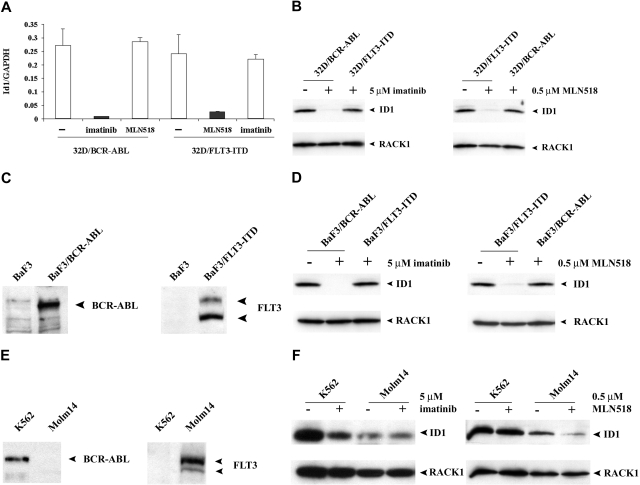
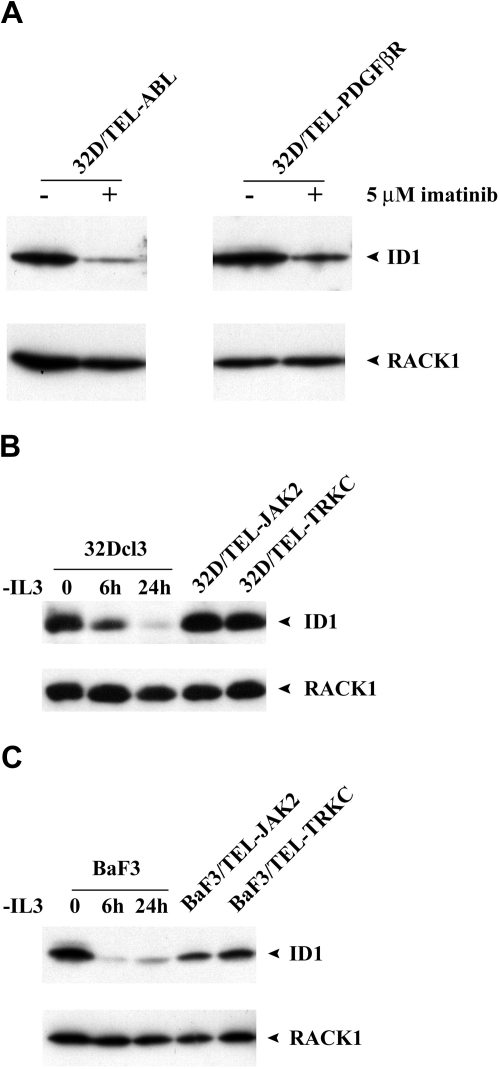
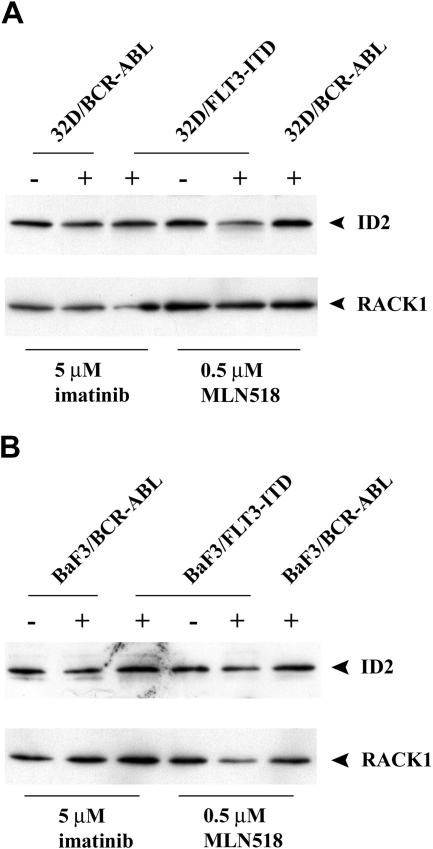
Oncogenic tyrosine kinases, such as BCR-ABL, TEL-ABL, TEL-PDGFbetaR, and FLT3-ITD, play a major role in the development of hematopoietic malignancy. They activate many of the same signal transduction pathways. To identify the critical target genes required for transformation in hematopoietic cells, we used a comparative gene expression strategy in which selective small molecules were applied to 32Dcl3 cells that had been transformed to factor-independent growth by these respective oncogenic alleles. We identified inhibitor of DNA binding 1 (Id1), a gene involved in development, cell cycle, and tumorigenesis, as a common target of these oncogenic kinases. These findings were prospectively confirmed in cell lines and primary bone marrow cells engineered to express the respective tyrosine kinase alleles and were also confirmed in vivo in murine models of disease. Moreover, human AML cell lines Molm-14 and K562, which express the FLT3-ITD and BCR-ABL tyrosine kinases, respectively, showed high levels of Id1 expression. Antisense and siRNA based knockdown of Id1-inhibited growth of these cells associated with increased p27(Kip1) expression and increased sensitivity to Trail-induced apoptosis. These findings indicate that Id1 is an important target of constitutively activated tyrosine kinases and may be a therapeutic target for leukemias associated with oncogenic tyrosine kinases.


Figures

Figure 1
Figure 1
Tyrosine kinase inhibitors specifically block the activity of oncogenic tyrosine kinases. (A) The experimental design to evaluate the common target genes of oncogenic tyrosine kinases by specific inhibitors (imatinib and MLN518) is shown schematically. (B) Western blot analysis of murine 32Dcl3 cells transduced with various oncogenic tyrosine kinases using c-Abl, FLT3, or PDGFβR antibodies. Untransduced 32Dcl3 cells were used as a negative control. (C) Western blot analysis of transduced 32Dcl3 cells treated with either imatinib or MLN518 using a Phospho-Stat5 (Tyr694; top panel) or Stat5b antibody (bottom panel). 32D/BCR-ABL cells treated with MLN518 or 32D/FLT3-ITD cells treated with imatinib were used as a negative control.
Figure 2
Figure 2
Expression of Id1 is specifically down-regulated by tyrosine kinase inhibitors. (A) Real-time quantitative RT-PCR analysis of transduced 32Dcl3 cells treated with either imatinib or MLN518 using Id1-specific primer. Results were normalized against the expression level of GAPDH. 32D/BCR-ABL cells treated with MLN518 or 32D/FLT3-ITD cells treated with imatinib were used as a negative control. (B) Western blot analysis of transduced 32Dcl3 cells treated with either imatinib or MLN518 using Id1 antibody. 32D/BCR-ABL cells treated with MLN518 or 32D/FLT3-ITD cells treated with imatinib were used as a negative control. The membrane was stripped and reblotted with a RACK1 antibody as a loading control. (C) Western blot analysis of murine BaF3 cells transduced with either BCR-ABL or FLT3-ITD using c-Abl or FLT3 antibody. Untransduced BaF3 cells were used as a negative control. (D) Western blot analysis of transduced BaF3 cells treated with either imatinib or MLN518 using Id1 antibody. BaF3/BCR-ABL cells treated with MLN518 or BaF3/FLT3-ITD treated with imatinib were used as a negative control. The membrane was stripped and reblotted with RACK1 antibody as loading control. (E) Western blot analysis of K562 cells and Molm-14 cells using c-Abl or FLT3 antibody. (F) Western blot analysis of K562 cells treated with imatinib or Molm-14 cells treated with MLN518 using Id1 antibody. K562 cells treated with MLN518 or Molm-14 cells treated with imatinib were used as a negative control. The membrane was stripped and reblotted with RACK1 antibody as loading control.
Figure 3
Figure 3
Expression of Id1 is up-regulated in other activated tyrosine kinases. (A) Western blot analysis of either BaF3/TEL-ABL or BaF3/TEL-PDGFβR cells treated with imatinib using Id1 antibody. The membrane was stripped and reblotted with RACK1 antibody as loading control. (B) Comparison of Id1 expression between parental 32Dcl3 cells deprived of IL3 for 6 or 24 hours and 32D/TEL-JAK2 or 32D/TEL-TRKC cells by Western blot analysis using Id1 antibody. The membrane was stripped and reblotted with RACK1 antibody as loading control. (C) Comparison of Id1 expression between parental BaF3 cells deprived of IL3 for 6 or 24 hours and BaF3/TEL-JAK2 or BaF3/TEL-TRKC cells by Western blot analysis using Id1 antibody. The membrane was stripped and reblotted with RACK1 antibody as loading control.
Figure 4
Figure 4
Treatment of tyrosine kinase inhibitors on expression of Id2. (A) Western blot analysis of transduced 32Dcl3 cells treated with either imatinib or MLN518 using Id2 antibody. 32D/BCR-ABL cells treated with MLN518 or 32D/FLT3-ITD cells treated with imatinib were used as a negative control. The membrane was stripped and reblotted with RACK1 antibody as loading control. (B) Western blot analysis of transduced BaF3 cells treated with either imatinib or MLN518 using Id2 antibody. BaF3/BCR-ABL cells treated with MLN518 or BaF3/FLT3-ITD treated with imatinib were used as a negative control. The membrane was stripped and reblotted with RACK1 antibody as loading control.
Figure 5
Figure 5
Id1 expression is increased after inducible expression of either BCR-ABL or FLT3-ITD. (A) TonB/BCR-ABL or TonB/FLT3-ITD cells were deprived of IL-3 for 15 hours before adding doxycycline (2 μg/mL). Whole cell lysates were harvested at the time point indicated and analyzed by Western blot using either c-Abl or FLT3 antibody (top panel). The membranes were reblotted with a Phospho-Stat5 (Tyr694) antibody (bottom panel). (B) Total RNA and whole cell lysates were harvested at 48 hours after addition of doxycycline (2 μg/mL). Real-time quantitative RT-PCR analysis of Id1 expression in inducible cell lines using Id1 specific primers (left). The results were normalized against the expression level of GAPDH. The corresponding Western blot analysis using Id1 antibody is listed on the right. The membrane was stripped and reblotted with RACK1 antibody as loading controls. (C) Total RNA and whole cell lysates were harvested at 48 hours after addition of doxycycline (2 μg/mL). Real-time quantitative RT-PCR analysis of Id2 expression in inducible cell lines using Id2 specific primers (left). The results were normalized against the expression level of GAPDH. The corresponding Western blot analysis using Id2 antibody is listed on the right. The membrane was stripped and reblotted with RACK1 antibody as loading control. (D) Total RNA was isolated from spleens of mice that developed myeloproliferative disease. Real-time quantitative RT-PCR was performed using Id1-specific primers. The results were normalized against the expression level of GAPDH. Total RNA from normal spleen was used as a negative control. (E) Total RNA was isolated from FACS-sorted GFP-positive primary murine bone marrow cells transduced with retroviral vectors coexpressing GFP alone, or GFP with either BCR-ABL or FLT3-ITD.
Figure 6
Figure 6
Effect of Id1 down-regulation on the growth of human leukemia cell lines. (A) Id1 expression in Molm-14 and K562 cells by Western blot analysis. The protein level of Id1 in stable antisense transfectant clones or transient si-RNA Id1 transfectant was expressed relative to that of parental cells by densitometry analysis. The membrane was stripped and reblotted with RACK1 antibody as loading controls, or reblotted with ID2 antibody as nonspecific controls. (B) Growth curve of Molm-14 and K562 cells measured by CellTiter 96 Aqueous One Solution Cell Proliferation Assay. Note that M1, M2 and Molm14-siId1 inhibit growth of Molm-14 cells, K1, K2, and K562-siId1 inhibit growth of K562 cells. Results shown are representative of 3 independent experiments. (C) Cell-cycle analysis of Molm-14 cells. Note that M1, M2, and Molm14-siId1 showed an increase in the G1 population. Representative experiments are shown here. (D) Western blot analysis of Molm-14 and K562 cells using p27Kip1 antibody. There is an approximately 2- to 3-fold increase of p27Kip1 protein in antisense transfectant clones, compared with parental cells or cells transduced with pBabe empty vector. The membrane was stripped and reblotted with RACK1 antibody as loading control.
Figure 7
Figure 7
Expression of Id1 protects leukemia cells from apoptosis. (A) Induction of apoptosis in K562 cells by Trail (5 ng/mL). Cells that exhibited annexin V staining were considered to be apoptotic. Percentage of GFP positive cells were shown in cells transiently transduced with lentiviral vectors coexpressing GFP and either siRNA-GL or siRNA-Id1. Results were derived from 2 independent experiments. (B) Western blot analysis of K562 cells using PARP antibody. An increased amount of 85-kDa fragment of PARP was observed in K1 and K2, compared with parental K562 cells or cells transduced with pBabe empty vector. (C) ID1 expression in HL60 cells by Western blot analysis. Note that ID1-transfected cells (H1 and H2) showed a significant increase in Id1 expression. (D) Induction of apoptosis in HL60 cells by serum starvation. Cells that displayed annexin V staining were considered to be apoptotic. Representative experiments are shown here. (E) Western blot analysis of HL60 cells (serum-starved for 72 hours) using PARP antibody. An increased amount of 85-kDa fragment of PARP was observed in parental HL60 cells and cells transduced with MSCV empty vector, compared with H1 or H2.

Similar articles

Cited by

References

    1. Daley GQ, Van Etten RA, Baltimore D. Induction of chronic myelogenous leukemia in mice by the P210bcr/abl gene of the Philadelphia chromosome. Science. 1990;247:824–830. - PubMed
    1. Daley GQ, Van Etten RA, Baltimore D. Blast crisis in a murine model of chronic myelogenous leukemia. Proc Natl Acad Sci U S A. 1991;88:11335–11338. - PMC - PubMed
    1. Van Etten RA, Jackson P, Baltimore D. The mouse type IV c-abl gene product is a nuclear protein, and activation of transforming ability is associated with cytoplasmic localization. Cell. 1989;58:669–678. - PubMed
    1. Elefanty AG, Hariharan IK, Cory S. bcr-abl, the hallmark of chronic myeloid leukaemia in man, induces multiple haemopoietic neoplasms in mice. EMBO J. 1990;9:1069–1078. - PMC - PubMed
    1. Okuda K, Golub TR, Gilliland DG, Griffin JD. p210BCR/ABL, p190BCR/ABL, and TEL/ABL activate similar signal transduction pathways in hematopoietic cell lines. Oncogene. 1996;13:1147–1152. - PubMed

MeSH terms