Review
. 2008 Aug;17(8):1295-307.
doi: 10.1110/ps.03259908. Epub 2008 Jun 17.

Allostery and cooperativity revisited

Affiliations
Review

Allostery and cooperativity revisited

Qiang Cui et al. Protein Sci. 2008 Aug.

Abstract

Although phenomenlogical models that account for cooperativity in allosteric systems date back to the early and mid-60's (e.g., the KNF and MWC models), there is resurgent interest in the topic due to the recent experimental and computational studies that attempted to reveal, at an atomistic level, how allostery actually works. In this review, using systems for which atomistic simulations have been carried out in our groups as examples, we describe the current understanding of allostery, how the mechanisms go beyond the classical MWC/Pauling-KNF descriptions, and point out that the "new view" of allostery, emphasizing "population shifts," is, in fact, an "old view." The presentation offers not only an up-to-date description of allostery from a theoretical/computational perspective, but also helps to resolve several outstanding issues concerning allostery.


Figures

Figure 1.
Figure 1.
Models for allostery. Pictorial representation of Pauling-KNF model and MWC model for a homodimer. Tertiary t and r states are indicated by squares and circles, respectively; liganded and unliganded states by filled and empty symbols, respectively. The states along the diagonal dotted line correspond to the Pauling-KNF model, in which there are only tertiary structural changes, and the left and right vertical columns to the MWC model, in which only quaternary structural changes occur. (The left column refers to the T state and the right column to the R state.) More complex models include all the states. Partition function for Pauling-KNF model: Ξ = 1 + 2Kλ + αK2 λ 2. K is the ligand binding constant for an individual subunit and α is the interaction constant; α is greater (less than) unity for positive (negative) cooperativity. Partition function for MWC model: Ξ = L(1 + cKλ)2 + (1 + Kλ)2. L is the equilibrium constant between the unligand T and R structures (L = [T]/[R]), K is the binding constant for a subunit in the R state and c is the reduction factor for binding to the T state.
Figure 2.
Figure 2.
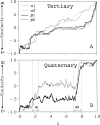
Tertiary and quaternary structural change in hemoglobin. The similarity to both end states (R and T) are plotted for structures obtained along the path (measured as the normalized root-mean-square deviation [RMSD] from the R[1] and T[−1] structures). For example, a value close to 1 (respectively, +1) indicates that the structure is very similar to the T state (respectively, R state); a value of zero indicates that the structure is equidistant from the two end states. Before calculating the RMSD, the two structures are superimposed by using a least-square fit. This makes possible a separation of the tertiary from the quaternary changes. For the tertiary change the least-square fit is done with respect to the atoms of each subunit, whereas for the quaternary change the least-square fit involves all atoms of the protein. Contributions from intrasubunit change were removed approximately from the quaternary similarity by substituting the internal coordinates of each subunit with those of a constant structure (chosen here as the average of T and R). The reaction coordinate λ is the normalized sum along the path of the change in all atomic coordinates. (A) The tertiary (i.e., intrasubunit) and (B) the quaternary (i.e., intersubunit) similarity are shown separately for each of the four subunits. The first (Q1) and second (Q2) major quaternary events are indicated (see Olsen et al. 2000).
Figure 3.
Figure 3.
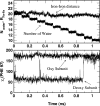
Role of water in allostery of the dimeric Scarpharca hemoglobin. (Top) The number of interfacial water molecules and the distance between irons as a function of time in the constrained molecular dynamic simulation. (Bottom) The corresponding dihedral angle χ1 for Phe 97 side chains (see Zhou et al. 2003).
Figure 4.
Figure 4.
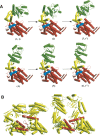
Conformational change in the GroEL cycle. (A) A set of structures on the path showing the behavior of a single subunit (apical domain in green, intermediate domain in yellow, equatorial domain in red; the nucleotide is shown in blue): (1) through (3) correspond to the first stages associated with nucleotide binding; (4) through (6) correspond to the second stage involving GroES binding. The early downward motion of the intermediate domain (compare [1,t] with [2] and [6,r″]) is the trigger for the overall transition. (B) The mechanism of the intermediate domain trigger. Two adjacent subunits from the crystal structures are shown in a view looking out from the inside. The key structural elements are in red; they are helices A, C, M, and the stem loop. The downward motion of helix M of the intermediate domain frees the apical domain for its upward movement and twist and also stabilizes the inclination of the equatorial domain. The arrows indicate the direction of the motion of the helices; the arrow along the axial direction of the C helix corresponds to an axial translation (see Ma et al. 2000).
Figure 5.
Figure 5.
Study of allosteric coupling in CheY. (A) Comparison of the inactive and active structures of CheY. Overlay of key residues between the phosphorylation (Asp 57) and response sites (Tyr 106). Residues in the active structure are colored according to atom types, while those in the inactive structure are colored as ice-blue. The inactive and active configurations of the β4–α4 loop are colored as dark blue and yellow, respectively. (B) A three-dimensional scheme that illustrates the energetics and possible pathways for CheY activation based on computed two-dimensional potentials of mean force along the key degrees of freedom. The expected fully active state, AF I, is not a local free-energy minimum in the simulations, presumably due to the absence of the FliM peptide in the model (see Ma and Cui 2007).

Similar articles

Cited by

References

    1. Abeliovich, H. An empirical extremum principle for the Hill coefficient in ligand–protein interactions showing negative cooperativity. Biophys. J. 2005;89:76–79. - PMC - PubMed
    1. Alberts, B. The cell as a collection of protein machines: Preparing the next generation of molecular biologists. Cell. 1998;92:291–294. - PubMed
    1. Anfinsen, C. Principles that govern the folding of protein chains. Science. 1973;181:223–230. - PubMed
    1. Appleby, J.L., Bourret, R.B. Proposed signal transduction role for conserved CheY residue Thr 87, a member of the response regulator active-site quintet. J. Bacteriol. 1998;180:3563–3569. - PMC - PubMed
    1. Bahar, I., Chenncebhotia, C., Tobi, D. Intrinsic dynamics of enzymes in the unbound state and relation to allosteric regulation. Curr. Opin. Struct. Biol. 2007;17:633–640. - PMC - PubMed

Publication types