. 2008 Jun 18;3(6):e2459.
doi: 10.1371/journal.pone.0002459.

Knockdown of cytosolic glutaredoxin 1 leads to loss of mitochondrial membrane potential: implication in neurodegenerative diseases

Affiliations

Knockdown of cytosolic glutaredoxin 1 leads to loss of mitochondrial membrane potential: implication in neurodegenerative diseases

Uzma Saeed et al. PLoS One. .

Abstract

Mitochondrial dysfunction including that caused by oxidative stress has been implicated in the pathogenesis of neurodegenerative diseases. Glutaredoxin 1 (Grx1), a cytosolic thiol disulfide oxido-reductase, reduces glutathionylated proteins to protein thiols and helps maintain redox status of proteins during oxidative stress. Grx1 downregulation aggravates mitochondrial dysfunction in animal models of neurodegenerative diseases, such as Parkinson's and motor neuron disease. We examined the mechanism underlying the regulation of mitochondrial function by Grx1. Downregulation of Grx1 by shRNA results in loss of mitochondrial membrane potential (MMP), which is prevented by the thiol antioxidant, alpha-lipoic acid, or by cyclosporine A, an inhibitor of mitochondrial permeability transition. The thiol groups of voltage dependent anion channel (VDAC), an outer membrane protein in mitochondria but not adenosine nucleotide translocase (ANT), an inner membrane protein, are oxidized when Grx1 is downregulated. We then examined the effect of beta-N-oxalyl amino-L-alanine (L-BOAA), an excitatory amino acid implicated in neurolathyrism (a type of motor neuron disease), that causes mitochondrial dysfunction. Exposure of cells to L-BOAA resulted in loss of MMP, which was prevented by overexpression of Grx1. Grx1 expression is regulated by estrogen in the CNS and treatment of SH-SY5Y cells with estrogen upregulated Grx1 and protected from L-BOAA mediated MMP loss. Our studies demonstrate that Grx1, a cytosolic oxido-reductase, helps maintain mitochondrial integrity and prevents MMP loss caused by oxidative insult. Further, downregulation of Grx1 leads to mitochondrial dysfunction through oxidative modification of the outer membrane protein, VDAC, providing support for the critical role of Grx1 in maintenance of MMP.


Conflict of interest statement

Competing Interests: The authors have declared that no competing interests exist.

Figures

Figure 1
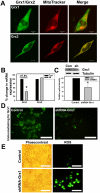
Figure 1. Localization of Grx1 in cytosol and generation of ROS following its knockdown in Neuro-2a cells.
Cells were loaded with MitoTracker Deep Red 633 (500 nM) for 45 min before fixation and subsequent immunostaining for Grx1 or Grx2. Images were captured using LSM510 META in confocal microscope. (A) Grx1 (green) does not colocalize with MitoTracker Deep Red 633 (red) in Neuro-2a cells indicating its cytosolic localization, whereas mitochondrial glutaredoxin 2 (green; Grx2) colocalizes with MitoTracker Deep Red. Bar represents 10 µm. (B) Quantitation of knockdown of Grx1 as assessed by qRT-PCR, no change observed in Grx2 mRNA levels. Data is represented as mean±SEM from 3 independent experiments. Asterisks indicate values significantly different from controls (p<0.01). (C) Immunoblots depicting Grx1 protein levels in control (con) and knockdown using shRNA (sh) in Neuro-2a cells and densitometric quantitation of immunoblot after normalization with β-tubulin. Data is represented as mean±SEM from 3 independent experiments. Asterisks indicate values significantly different from controls (p<0.01). (D) Immunostaining for Grx1 in Neuro-2a cells transfected with empty vector or shRNA to Grx1. Bar represents 100 µM. (E) Downregulation of Grx1 using shRNA in Neuro-2a cells enhances ROS production as seen by increased H2DCFDA staining. Bar represents 100 µm.
Figure 2
Figure 2. Loss of MMP in Neuro-2a cells correlates with optimum knockdown of Grx1.
Cells were transfected with empty vector (control for 12 and 72 hr; (Fig. 2A)) or shRNA to Grx1 (Fig. 2B) and loss of MMP was monitored after 12, 24, 48 and 72 hr of transfection using JC-1 (2 µg/ml) dye. Loss of MMP in response to downregulation of Grx1 was found to be maximum after 72 hr of transfection. Green staining represents JC-1 monomer in cells with loss of MMP whereas red staining represents JC-1 aggregates in cells with intact MMP. Bar represents 120 µm.
Figure 3
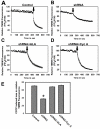
Figure 3. Quantitative determination of loss of MMP in Neuro-2a cells in response to Grx1 knockdown.
Grx1 was downregulated in Neuro-2a cells using shRNA to Grx1. Cells were treated with vehicle after transfecting them with empty vector, or with vehicle, α-lipoic acid (100 µM) or cyclosporine A (10 µM), 6 hr after the transfection with shRNA to Grx1. MMP was measured using TMRM as the indicator dye 72 hr after the transfection. Cells were loaded with TMRM and imaged to measure change in TMRM intensity for 300 sec prior to the addition of CCCP. Loss of TMRM intensity was further measured for 300 sec after the addition of CCCP. Cells transfected with empty vector show abrupt decrease in TMRM intensity after CCCP treatment representing sudden loss of MMP (A). Gradual decrease in TMRM intensity in cells transfected with shRNA to Grx1 represents steady loss of MMP even before CCCP treatment which further decays gradually on its addition (B). MMP was maintained in shRNA transfected cells pretreated with α-lipoic acid (C) or cyclosporine A (D). The difference in TMRM fluorescence 2 sec prior and 300 sec after CCCP addition was considered as relative measure of MMP in different groups (E). The data shown are mean±SEM for 25 to 30 cells from 3 independent experiments in each group. Asterisk indicates values significantly different from controls (p<0.05). Loss of MMP due to the Grx1 knockdown is maintained by pretreating the cells with α-lipoic acid and cyclosporine A (E). Arrow represents time point of addition of CCCP.
Figure 4
Figure 4. Grx1 silencing causes MMP loss which can be prevented by thiol antioxidants and cyclosporine A.
SH-SY5Y cells were transfected with empty vector or shRNA to Grx1 and were used for quantitation of Grx1 at mRNA and protein levels and for the qualitative observation of MMP loss, 72 hr after the transfection. (A) Immunocytochemistry for Grx1 in cells transfected with shRNA to Grx1 show decreased Grx1 levels as compared to the mock control. Bar represents 100 µm. (B) Quantitation of knockdown of Grx1 mRNA levels as assessed by qRT-PCR in SH-SY5Y cells transfected with empty vector or shRNA to Grx1. (C) Immunoblots showing optimal knockdown of Grx1 protein levels in cells transfected with shRNA to Grx1 and densitometric quantitation of immunoblot after normalization with β-tubulin. (D) Loss of MMP was observed in cells transfected with shRNA to Grx1 but not in the cells transfected with empty vector. Pretreatment of cells with cyclosporine A (10 µM) or α-lipoic acid (100 µM) prevented the loss of MMP and only the red aggregates of JC-1 representing healthy cells were observed. Bar represents 120 µm.
Figure 5
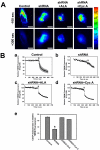
Figure 5. Quantitative determination of loss of MMP in SH-SY5Y cells in response to Grx1 knockdown.
Grx1 was downregulated in SH-SY5Y cells using shRNA. Cells were treated with vehicle after transfecting them with empty vector, or with vehicle, α-lipoic acid (100 µM) or cyclosporine A (10 µM), 6 hr post transfection with shRNA to Grx1 and MMP was measured using TMRM as the indicator dye. Cells were loaded with TMRM and imaged to measure change in TMRM intensity for 300 sec prior to the addition of CCCP. Loss of TMRM intensity was further measured for 300 sec after the addition of CCCP. (A) Representative fluorescence images of cells transfected with empty vector or shRNA and treated with either vehicle, α-lipoic acid or cyclosporine A, 100 sec before and 300 sec after addition of CCCP. Bar represents 120 µm. The fluorescence profile in the cell is represented in the pseudocolor bar. (B) Quantification of change in MMP (Δψm). Cells transfected with empty vector show abrupt decrease in TMRM intensity after CCCP treatment representing sudden loss of MMP (a). Gradual decrease in TMRM intensity in cells transfected with shRNA to Grx1 represents steady loss of MMP before CCCP treatment, which further decays on adding CCCP (b). MMP was maintained in shRNA transfected cells pretreated with α-lipoic acid (c) and with cyclosporine A (d). The difference in TMRM fluorescence 2 sec prior and 300 sec after CCCP addition was considered as relative measure of MMP in different groups (e). The data shown are mean±SEM for 25 to 30 cells from 3 independent experiments in each group. Asterisks indicate values significantly different from controls (p<0.05). Loss of MMP caused by Grx1 knockdown is maintained by pretreating the cells with α-lipoic acid (c,e) and cyclosporine A (d,e). Arrow represents time point of addition of CCCP.
Figure 6
Figure 6. Overexpression of Grx1 prevents loss of MMP and L-BOAA mediated cell toxicity.
Grx1 overexpressing SH-SY5Y clonal cell line and control cell lines electroporated with mock empty vector were characterized for the expression of Grx1 by immunostaining (A), quantitation of mRNA by qRT-PCR (B) and immunoblot (C). SH-SY5Y cells stably overexpressing Grx1 and those electroporated with empty vector (control) were exposed to L-BOAA (1 mM) for 24 hr before determining the cell viability. Cells overexpressing Grx1 show more viability after L-BOAA exposure as compared to the control cells (D). Data is represented as mean±SD from 3 independent experiments. Asterisks indicate values significantly different from controls (p<0.05). SH-SY5Y clonal lines overexpressing Grx1 and mock control cells were subjected to L-BOAA (1 mM) treatment for 24 hr before qualitative determination of their MMP status using JC-1 (2 µg/ml). The former (Grx1 overexpressing cell line) maintained MMP following exposure to L-BOAA while control cells showed loss of MMP detected as green JC-1 monomers (E). Bar represents 120 µm.
Figure 7
Figure 7. Estrogen upregulates Grx1 and confers protection against L-BOAA toxicity by maintaining MMP.
(A) Immunocytochemical staining of estrogen receptors α and β in SH-SY5Y cells. Bar represents 100 µm. (B) SH-SY5Y cells were treated with 17-β estradiol (200 nM) for 24 and 48 hr. One set of cells was pretreated with estrogen receptor antagonist ICI 182780 (1 nM), 1 hr prior to the treatment with 17-β estradiol. Immunostaining for Grx1 shows its upregulation on exposure to 17-β estradiol, which is prevented by ICI 182,780. Bar represents 100 µm. (C) Immunoblot showing upregulation of Grx1 in response to 17-β estradiol (+Est) as compared with control (Con). Densitometric quantitation of immunoblot after normalization with β-tubulin. Data is represented as mean±SD from 3 independent experiments. Asterisks indicate values significantly different from controls (p<0.05). (D) SH-SY5Y cells were exposed to estrogen (200 nM) for 24 hr before treating them with L-BOAA (1 mM; 24 hr) and loaded with JC-1 for monitoring MMP. L-BOAA mediated loss of MMP was abolished in cells pretreated with estrogen as compared to vehicle treated controls. Bar represents 120 µm. (E) Cells were pretreated with 17-β estradiol (200 nM) or vehicle for 24 hrs before exposure to L-BOAA (500 µM; 24 hr). 17-β estradiol protects against L-BOAA mediated cytotoxicity. Data is represented as mean±SD from 3 independent experiments. Asterisks indicate values significantly different from controls (p<0.05).
Figure 8
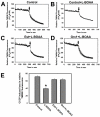
Figure 8. Exposure to estrogen or overexpression of Grx1 abolishes L-BOAA induced MMP loss in SH-SY5Y cells.
Cells pretreated with 17-β estradiol (200 nM) and cells stably overexpressing Grx1 were treated with L-BOAA (1 mM; 24 hr). Vehicle treated cells show abrupt decrease in TMRM intensity after CCCP treatment representing sudden loss of MMP (A). Gradual decrease in TMRM intensity in cells treated with L-BOAA represents steady loss of MMP before CCCP treatment, which further decays on adding CCCP (B). MMP is maintained in SH-SY5Y pretreated with 17-β estradiol (C) and in cell lines overexpressing Grx1 (D). L-BOAA mediated loss of MMP is prevented by either pretreating the cells with 17-β estradiol or overexpression of Grx1 (E). Data is represented as mean±SEM from 3 independent experiments. Asterisks indicate values significantly different from controls (p<0.05). Arrow represents time point of addition of CCCP.
Figure 9
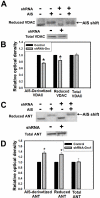
Figure 9. Downregulation of Grx1 causes oxidative modification of thiol groups of voltage dependent anion channel (VDAC).
Neuro-2a cells were transfected with shRNA to Grx1 or empty vector and the cell lysates were incubated with AIS which alkylates the free thiol groups thus causing a shift in the migration on non-reducing SDS-PAGE. (A) Immunoblot depicting reduced and AIS derivatized VDAC. Total cell lysate of Neuro-2a cells transfected with empty vector (shRNA ‘−’) or shRNA to Grx1 (shRNA ‘+’) were subjected to non-reducing SDS-PAGE. Reduced VDAC measured as such (AIS ‘−’ ) and as AIS derivatized VDAC (AIS ‘+’), is shown. Total VDAC from control (shRNA ‘−’) or shRNA to Grx1 (shRNA ‘+’) transfected cells was measured using reducing SDS-PAGE followed by immunoblotting. (B) Densitometric measurements of the immunoblots depicted in (A). Reduced and AIS derivatized VDAC were normalized with total VDAC. Values are mean±SD (n = 6) individual experiments. Asterisks indicate values significantly different from controls (p<0.01). (C) Immunoblot depicting reduced and AIS derivatized ANT. Total cell lysate of Neuro-2a cells transfected with empty vector (shRNA ‘−’) or shRNA to Grx1 (shRNA ‘+’) were subjected to non-reducing SDS-PAGE. Reduced ANT measured as such (AIS ‘−’) and as AIS derivatized ANT (AIS ‘+’), are depicted. Total ANT from control (shRNA ‘−’) or shRNA to Grx1 (shRNA ‘+’) transfected cells was measured using reducing SDS-PAGE followed by immunoblotting. (D) Densitometric measurements of the immunoblots shown in (C). Reduced and AIS derivatized ANT were normalized with total ANT. Values are mean±SD (n = 6) individual experiments. Asterisks indicate values significantly different from controls (p<0.01).
Figure 10
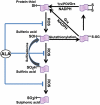
Figure 10. Oxidative modification of thiol groups in proteins:
Protein thiols may be oxidized sequentially to sulfenic, sulfinic and sulfonic acid. Sulfenic acids can react with GSH to form PrSSG thus preventing their irreversible oxidation to sulfonic acids. PrSSG may be further modified to protein mixed disulfides. PrSSG are reduced back to protein thiols very effectively by Grx1 utilizing GSH and reducing equivalents of NADPH. The thiol antioxidant, α-lipoic acid, can potentially prevent the oxidative modification of protein thiols.
Figure 11
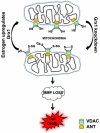
Figure 11. Cytosolic Grx1 downregulation results in loss of mitochondrial membrane potential:
Downregulation of cytosolic Grx1 leads to modification of critical thiol groups of the outer mitochondrial membrane protein VDAC, resulting in loss of membrane potential which could eventually lead to cell death. Grx1 expression is regulated by estrogen and its upregulation by estrogen prevents MMP loss by maintaining redox status of critical thiol groups in the mitochondria.

Similar articles

Cited by

References

    1. Bambrick LL, Fiskum G. Mitochondrial dysfunction in mouse trisomy 16 brain. Brain Res. 2008;1188:9–16. - PubMed
    1. Orth M, Schapira AH. Mitochondria and degenerative disorders. Am J Med Genet. 2001;106:27–36. - PubMed
    1. Sriram K, Shankar SK, Boyd MR, Ravindranath V. Thiol oxidation and loss of mitochondrial complex I precede excitatory amino acid-mediated neurodegeneration. J Neurosci. 1998;18:10287–10296. - PMC - PubMed
    1. Solans A, Zambrano A, Rodriguez M, Barrientos A. Cytotoxicity of a mutant huntingtin fragment in yeast involves early alterations in mitochondrial OXPHOS complexes II and III. Hum Mol Genet. 2006;15:3063–3081. - PubMed
    1. Benchoua A, Trioulier Y, Zala D, Gaillard MC, Lefort N, et al. Involvement of mitochondrial complex II defects in neuronal death produced by N-terminus fragment of mutated huntingtin. Mol Biol Cell. 2006;17:1652–1663. - PMC - PubMed

Publication types