

Functional annotation and identification of candidate disease genes by computational analysis of normal tissue gene expression data
- PMID: 18560577
- PMCID: PMC2409962
- DOI: 10.1371/journal.pone.0002439
Functional annotation and identification of candidate disease genes by computational analysis of normal tissue gene expression data
Abstract
Background: High-throughput gene expression data can predict gene function through the "guilt by association" principle: coexpressed genes are likely to be functionally associated.
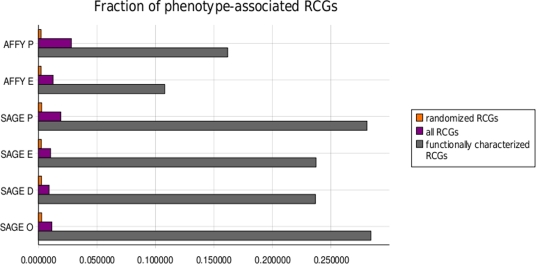
Methodology/principal findings: We analyzed publicly available expression data on normal human tissues. The analysis is based on the integration of data obtained with two experimental platforms (microarrays and SAGE) and of various measures of dissimilarity between expression profiles. The building blocks of the procedure are the Ranked Coexpression Groups (RCG), small sets of tightly coexpressed genes which are analyzed in terms of functional annotation. Functionally characterized RCGs are selected by means of the majority rule and used to predict new functional annotations. Functionally characterized RCGs are enriched in groups of genes associated to similar phenotypes. We exploit this fact to find new candidate disease genes for many OMIM phenotypes of unknown molecular origin.
Conclusions/significance: We predict new functional annotations for many human genes, showing that the integration of different data sets and coexpression measures significantly improves the scope of the results. Combining gene expression data, functional annotation and known phenotype-gene associations we provide candidate genes for several genetic diseases of unknown molecular basis.
Conflict of interest statement
Figures
References
Publication types
MeSH terms
LinkOut - more resources
Full Text Sources
Other Literature Sources
