

Association mapping by generalized linear regression with density-based haplotype clustering
- PMID: 18561202
- PMCID: PMC2952426
- DOI: 10.1002/gepi.20352
Association mapping by generalized linear regression with density-based haplotype clustering
Abstract
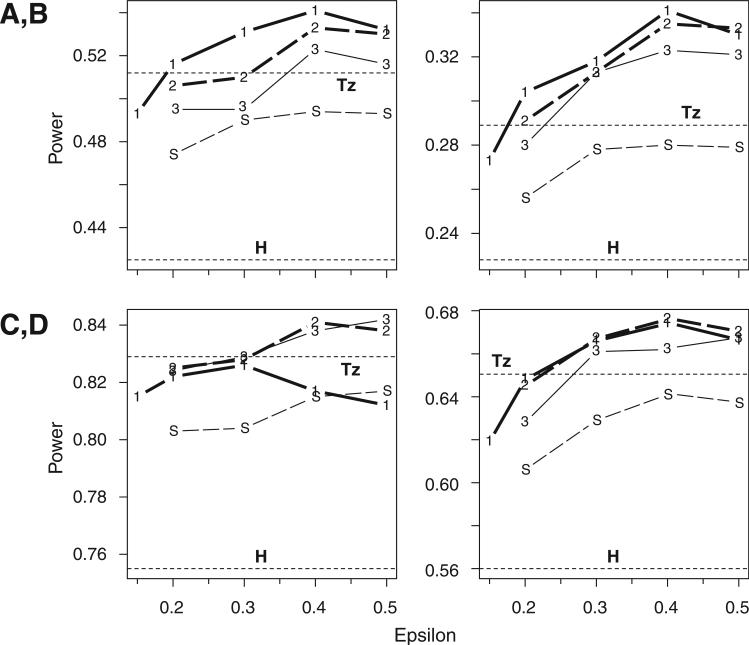
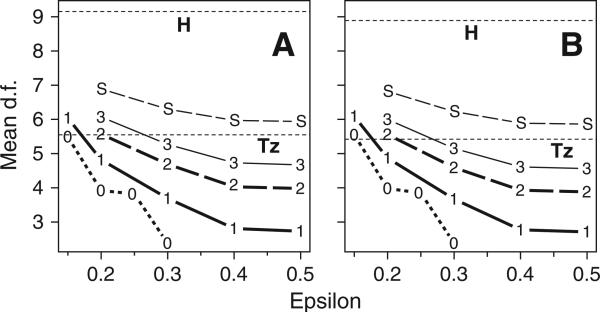
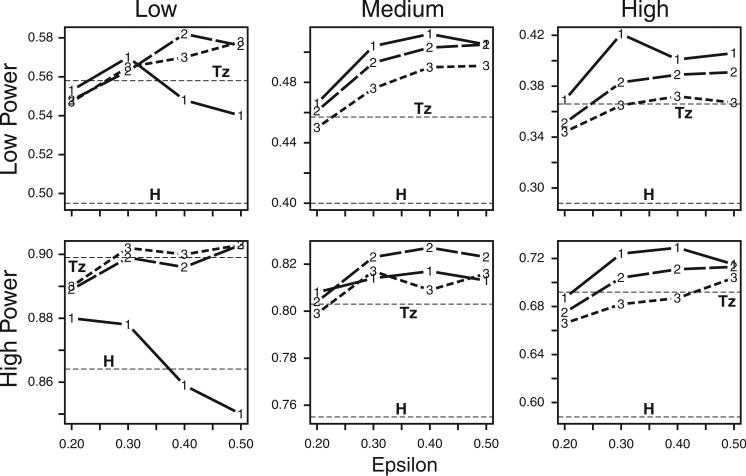
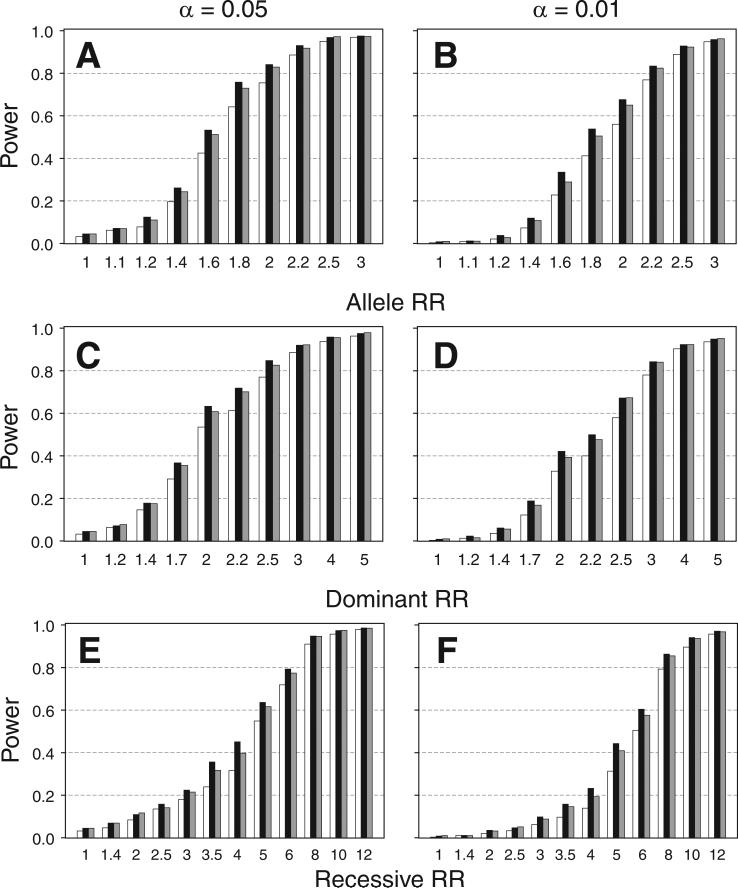
Haplotypes of closely linked single-nucleotide polymorphisms (SNPs) potentially offer greater power than individual SNPs to detect association between genetic variants and disease. We present a novel approach for association mapping in which density-based clustering of haplotypes reduces the dimensionality of the general linear model (GLM)-based score test of association implemented in the HaploStats software (Schaid et al. [2002] Am. J. Hum. Genet. 70:425-434). A flexible haplotype similarity score, a generalization of previously used measures, forms the basis, for grouping haplotypes of probable recent common ancestry. All haplotypes within a cluster are assigned the same regression coefficient within the GLM, and evidence for association is assessed with a score statistic. The approach is applicable to both binary and continuous trait data, and does not require prior phase information. Results of simulation studies demonstrated that clustering enhanced the power of the score test to detect association, under a variety of conditions, while preserving valid Type-I error. Improvement in performance was most dramatic in the presence of extreme haplotype diversity, while a slight improvement was observed even at low diversity. Our method also offers, for binary traits, a slight advantage in power over a similar approach based on an evolutionary model (Tzeng et al. [2006] Am. J. Hum. Genet. 78:231-242).
Figures
Similar articles
-
Genetic association mapping via evolution-based clustering of haplotypes.PLoS Genet. 2007 Jul;3(7):e111. doi: 10.1371/journal.pgen.0030111. PLoS Genet. 2007. PMID: 17616979 Free PMC article.
-
Haplotype-based quantitative trait mapping using a clustering algorithm.BMC Bioinformatics. 2006 May 18;7:258. doi: 10.1186/1471-2105-7-258. BMC Bioinformatics. 2006. PMID: 16709248 Free PMC article.
-
Regression-based association analysis with clustered haplotypes through use of genotypes.Am J Hum Genet. 2006 Feb;78(2):231-42. doi: 10.1086/500025. Epub 2005 Dec 19. Am J Hum Genet. 2006. PMID: 16365833 Free PMC article.
-
Tag SNP selection for association studies.Genet Epidemiol. 2004 Dec;27(4):365-74. doi: 10.1002/gepi.20028. Genet Epidemiol. 2004. PMID: 15372618 Review.
-
Evaluating associations of haplotypes with traits.Genet Epidemiol. 2004 Dec;27(4):348-64. doi: 10.1002/gepi.20037. Genet Epidemiol. 2004. PMID: 15543638 Review.
Cited by
-
Using an uncertainty-coding matrix in Bayesian regression models for haplotype-specific risk detection in family association studies.PLoS One. 2011;6(7):e21890. doi: 10.1371/journal.pone.0021890. Epub 2011 Jul 15. PLoS One. 2011. PMID: 21789192 Free PMC article.
-
Gene genealogies for genetic association mapping, with application to Crohn's disease.Front Genet. 2013 Dec 2;4:260. doi: 10.3389/fgene.2013.00260. eCollection 2013. Front Genet. 2013. PMID: 24348515 Free PMC article.
-
A novel approach for haplotype-based association analysis using family data.BMC Bioinformatics. 2010 Jan 18;11 Suppl 1(Suppl 1):S45. doi: 10.1186/1471-2105-11-S1-S45. BMC Bioinformatics. 2010. PMID: 20122219 Free PMC article.
References
-
- Akey J, Jin L, Xiong M. Haplotypes vs. single marker linkage disequilibrium tests: what do we gain? Eur J Hum Genet. 2001;9:291–300. - PubMed
-
- Bardel C, Danjean V, Génin E. ALTree: association detection and localization of susceptibility sites using haplotype phylogenetic trees. Bioinformatics. 2006;22:1402–1403. - PubMed
-
- Boos DD. On generalized score tests. Am Stat. 1992;46:327–333.
-
- Bourgain C, Génin E, Quesneville H, Clerget-Darpoux F. Search for multifactorial disease susceptibility genes in founder populations. Ann Hum Genet. 2000;64:255–265. - PubMed
Publication types
MeSH terms
Grants and funding
LinkOut - more resources
Full Text Sources
