Computer-aided diagnosis for the classification of focal liver lesions by use of contrast-enhanced ultrasonography
- PMID: 18561648
- PMCID: PMC2809729
- DOI: 10.1118/1.2900109
Computer-aided diagnosis for the classification of focal liver lesions by use of contrast-enhanced ultrasonography
Abstract
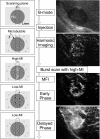
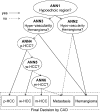
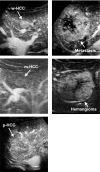
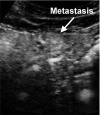
The authors developed a computer-aided diagnostic (CAD) scheme for classifying focal liver lesions (FLLs) as liver metastasis, hemangioma, and three histologic differentiation types of hepatocellular carcinoma (HCC), by use of microflow imaging (MFI) of contrast-enhanced ultrasonography. One hundred and three FLLs obtained from 97 cases used in this study consisted of 26 metastases (15 hyper- and 11 hypovascularity types), 16 hemangiomas (five hyper- and 11 hypovascularity types) and 61 HCCs: 24 well differentiated (w-HCC), 28 moderately differentiated (m-HCC), and nine poorly differentiated (p-HCC). Pathologies of all cases were determined based on biopsy or surgical specimens. Locations and contours of FLLs on contrast-enhanced images were determined manually by an experienced physician. MFI was obtained with contrast-enhanced low-mechanical-index (MI) pulse subtraction imaging at a fixed plane which included a distinctive cross section of the FLL. In MFI, the inflow high signals in the plane, which were due to the vascular patterns and the contrast agent, were accumulated following flash scanning with a high-MI ultrasound exposure. In the initial step of our computerized scheme, a series of the MFI images was extracted from the original cine clip (AVI format). We applied a smoothing filter and time-sequential running average techniques in order to reduce signal noise on the single MFI image and cyclic noise on the sequential MFI images, respectively. A kidney, vessels, and a liver parenchyma region were segmented automatically by use of the last image of a series of MFI images. The authors estimated time-intensity curves for an FLL by use of a series of the temporally averaged MFI images in order to determine temporal features such as estimated replenishment times at early and delayed phases, flow rates, and peak times. In addition, they extracted morphologic and gray-level image features which were determined based on the physicians' knowledge of the diagnosis of the FLL, such as the size of lesion, vascular patterns, and the presence of hypoechoic regions. They employed a cascade of six independent artificial neural networks (ANNs) by use of extracted temporal and image features for classifying five types of liver diseases. A total of 16 temporal and image features, which were selected from 43 initially extracted features, were used for six different ANNs for making decisions at each decision in the cascade. The ANNs were trained and tested with a leave-one-lesion-out test method. The classification accuracies for the 103 FLLs were 88.5% for metastasis, 93.8% for hemangioma, and 86.9% for all HCCs. In addition, the classification accuracies for histologic differentiation types of HCCs were 79.2% for w-HCC, 50.0% for m-HCC, and 77.8% for p-HCC. The CAD scheme for classifying FLLs by use of the MFI on contrast-enhanced ultrasonography has the potential to improve the diagnostic accuracy in the histologic diagnosis of HCCs and the other liver diseases.
Figures


References
-
- Laghi A., Iannaccone R., Rossi P., Carbone I., Ferrari R., Mangiapane F., Nofroni I., and Passariello R., “Hepatocellular carcinoma: detection with triple-phase multi-detector row helical CT in patients with chronic hepatitis,” Radiology 226, 543–549 (2003). - PubMed
-
- Martin D. R., and Semelka R. C., “Imaging of benign and malignant focal liver lesions,” Magn. Reson. Imaging Clin. N. Am. 9, 785–802 (2001). - PubMed
-
- Hussain S. M., Semelka R. C., and Mitchell D. G., “MR imaging of hepatocellular carcinoma,” Magn. Reson. Imaging Clin. N. Am. 10, 31–52 (2002). - PubMed
-
- Yamashita Y., Hatanaka Y., Yamamoto H., Arakawa A., Matsukawa T., Miyazaki T., and Takahashi M., “Differential diagnosis of focal liver lesions: role of spin-echo and contrast-enhanced dynamic MR imaging,” Radiology 193, 59–65 (1994). - PubMed
-
- Wernecke K., Rummeny E., Bongartz G., Vassallo P., Kivelitz D., Wiesmann W., Peters P. E., Reers B., Reiser M., and Pircher W., “Detection of hepatic masses in patients with carcinoma: Comparative sensitivities of sonography, CT, and MR imaging,” AJR Am. J. Roentgenol. 157, 731–739 (1991). - PubMed
Publication types
MeSH terms
Substances
Grants and funding
LinkOut - more resources
Full Text Sources
Medical
Miscellaneous

