The performance of interventional loopless MRI antennae at higher magnetic field strengths
- PMID: 18561676
- PMCID: PMC2669652
- DOI: 10.1118/1.2905027
The performance of interventional loopless MRI antennae at higher magnetic field strengths
Abstract
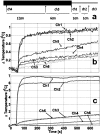
Interventional, "loopless antenna" MRI detectors are currently limited to 1.5 T. This study investigates whether loopless antennae offer signal-to-noise ratio (SNR) and field-of-view (FOV) advantages at higher fields, and whether device heating can be controlled within safe limits. The absolute SNR performance of loopless antennae from 0.5 to 5 T is investigated both analytically, using electromagnetic (EM) dipole antenna theory, and numerically with the EM method of moments, and found to vary almost quadratically with field strength depending on the medium's electrical properties, the noise being dominated by direct sample conduction losses. The prediction is confirmed by measurements of the absolute SNR of low-loss loopless antennae fabricated for 1.5, 3, and 4.7 T, immersed in physiologically comparable saline. Gains of 3.8 +/- 0.2- and 9.7 +/- 0.3-fold in SNR, and approximately 10- and 50-fold gains in the useful FOV area are observed at 3 and 4.7 T, respectively, compared to 1.5 T. Heat testing of a 3 T biocompatible nitinol-antenna fabricated with a redesigned decoupling circuit shows maximum heating of approximately 1 degrees C for MRI operating at high MRI exposure levels. Experiments in the rabbit aorta confirm the SNR and FOV advantages of the 3 T antenna versus an equivalent commercial 1.5 T device in vivo. This work is the first to study the performance of experimental internal MRI detectors above 1.5 T. The large SNR and FOV gains realized present a major opportunity for high-resolution imaging of vascular pathology and MRI-guided intervention.
Figures


Similar articles
-
Monitoring local heating around an interventional MRI antenna with RF radiometry.Med Phys. 2015 Mar;42(3):1411-23. doi: 10.1118/1.4907960. Med Phys. 2015. PMID: 25735295 Free PMC article.
-
Interventional loopless antenna at 7 T.Magn Reson Med. 2012 Sep;68(3):980-8. doi: 10.1002/mrm.23280. Epub 2011 Dec 12. Magn Reson Med. 2012. PMID: 22161992 Free PMC article.
-
7 Tesla MRI with a transmit/receive loopless antenna and B1-insensitive selective excitation.Magn Reson Med. 2014 Jul;72(1):220-6. doi: 10.1002/mrm.24910. Epub 2013 Aug 20. Magn Reson Med. 2014. PMID: 23963978 Free PMC article.
-
Interventional MRI: tapering improves the distal sensitivity of the loopless antenna.Magn Reson Med. 2010 Mar;63(3):797-802. doi: 10.1002/mrm.22152. Magn Reson Med. 2010. PMID: 20187186 Free PMC article.
-
MR systems for MRI-guided interventions.J Magn Reson Imaging. 2008 Feb;27(2):253-66. doi: 10.1002/jmri.21269. J Magn Reson Imaging. 2008. PMID: 18219680 Review.
Cited by
-
Initial feasibility testing of limited field of view magnetic resonance thermometry using a local cardiac radiofrequency coil.Magn Reson Med. 2013 Oct;70(4):994-1004. doi: 10.1002/mrm.24534. Epub 2012 Nov 19. Magn Reson Med. 2013. PMID: 23165722 Free PMC article.
-
Monitoring local heating around an interventional MRI antenna with RF radiometry.Med Phys. 2015 Mar;42(3):1411-23. doi: 10.1118/1.4907960. Med Phys. 2015. PMID: 25735295 Free PMC article.
-
Radiofrequency Ablation, MR Thermometry, and High-Spatial-Resolution MR Parametric Imaging with a Single, Minimally Invasive Device.Radiology. 2016 Dec;281(3):927-932. doi: 10.1148/radiol.2016151447. Epub 2016 May 26. Radiology. 2016. PMID: 27228330 Free PMC article.
-
Toward imaging the body at 10.5 tesla.Magn Reson Med. 2017 Jan;77(1):434-443. doi: 10.1002/mrm.26487. Epub 2016 Oct 21. Magn Reson Med. 2017. PMID: 27770469 Free PMC article.
-
High-resolution intravascular MRI-guided perivascular ultrasound ablation.Magn Reson Med. 2020 Jan;83(1):240-253. doi: 10.1002/mrm.27932. Epub 2019 Aug 11. Magn Reson Med. 2020. PMID: 31402512 Free PMC article.
References
-
- Arepally A., Karmarkar P. V., Weiss C., and Atalar E., “Percutaneous MR imaging-guided transvascular access of mesenteric venous system: Study in swine model,” Radiology RADLAX 238, 113–118 (2006). - PubMed
-
- Raval A. N., Karmarkar P. V., Guttman M. A., Ozturk C., Sampath S., DeSilva R., Aviles R. J., Xu M., Wright V. J., Schenke W. H., Kocaturk O., Dick A. J., Raman V. K., Atalar E., McVeigh E. R., and Lederman R. J., “Real-time magnetic resonance imaging-guided endovascular recanalization of chronic total arterial occlusion in a swine model,” Circulation CIRCAZ 113, 1101–1107 (2006). - PMC - PubMed
-
- Chaabane L., Canet E., Serfaty J. M., Contard F., Guerrier D., Douek P., and Briguet A., “Microimaging of atherosclerotic plaque in animal models,” MAGMA (N.Y.) MAGMEY 11, 58–60 (2000). - PubMed
-
- Di Mario C., The S. H., Madretsma S., van Suylen R. J., Wilson R. A., Bom N., Serruys P. W., Gussenhoven E. J., and Roelandt J. R., “Detection and characterization of vascular lesions by intravascular ultrasound: An in vitro study correlated with histology,” J. Am. Soc. Echocardiogr ZZZZZZ 5, 135–146 (1992). - PubMed
-
- Rivas P. A., Nayak K. S., Scott G. C., McConnell M. V., Kerr A. B., Nishimura D. G., Pauly J. M., and Hu B. S., “In vivo real-time intravascular MRI,” J. Cardiovasc. Magn. Reson. 4, 223–232 (2002). - PubMed
Publication types
MeSH terms
Substances
Grants and funding
LinkOut - more resources
Full Text Sources
Other Literature Sources

