

An investigation of the accuracy of an IMRT dose distribution using two- and three-dimensional dosimetry techniques
- PMID: 18561683
- PMCID: PMC2562315
- DOI: 10.1118/1.2899995
An investigation of the accuracy of an IMRT dose distribution using two- and three-dimensional dosimetry techniques
Abstract
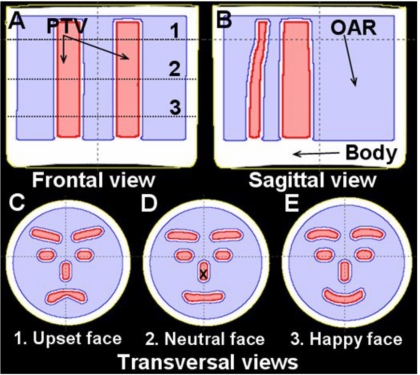
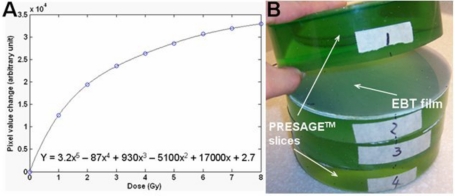
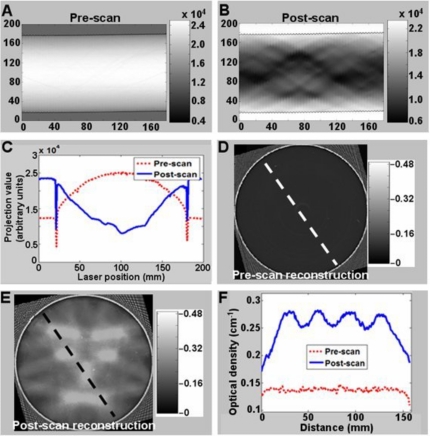
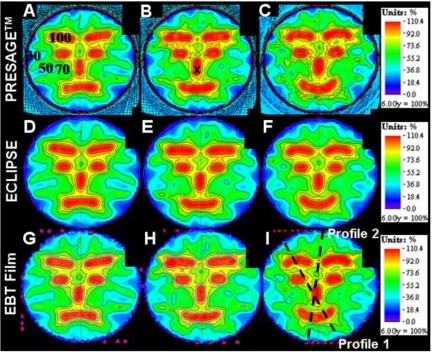
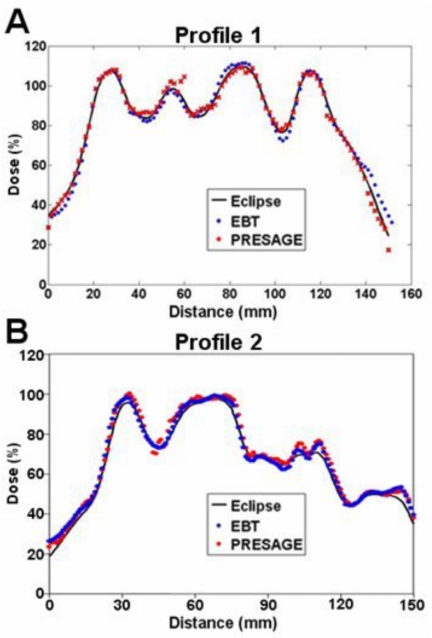
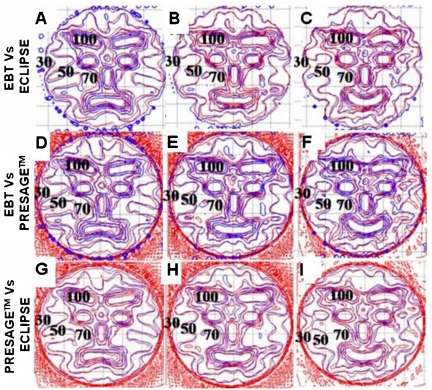
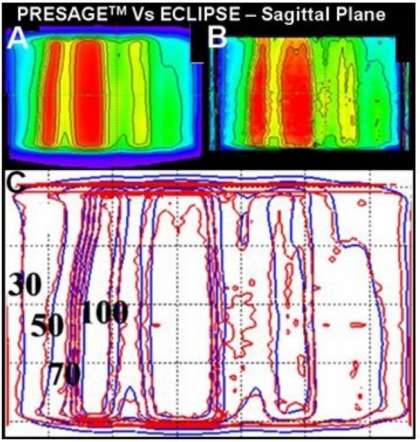
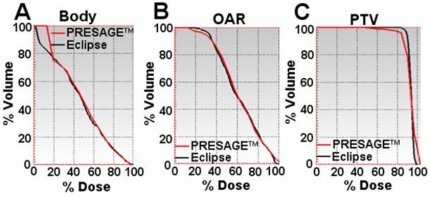
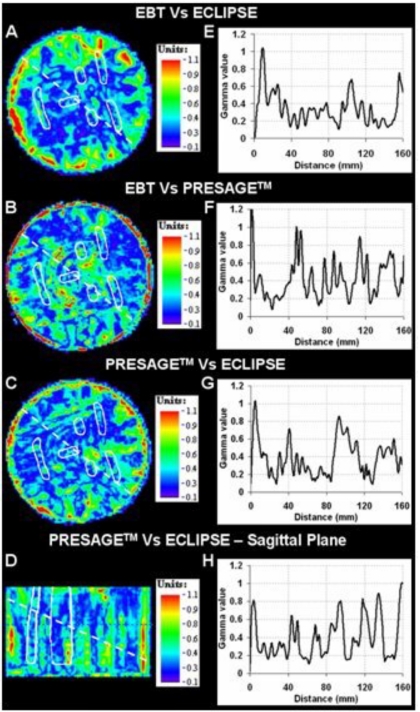
Complex dose delivery techniques like intensity-modulated radiation therapy (IMRT) require dose measurement in three dimensions for comprehensive validation. Previously, we demonstrated the feasibility of the "PRESAGE/optical-computed tomography (CT)" system for the three-dimensional verification of simple open beam dose distributions where the planning system was known to be accurate. The present work extends this effort and presents the first application of the PRESAGE/optical-CT system for the verification of a complex IMRT distribution. A highly modulated 11 field IMRT plan was delivered to a cylindrical PRESAGE dosimeter (16 cm in diameter and 11 cm in height), and the dose distribution was readout using a commercial scanning-laser optical-CT scanner. Comparisons were made with independent GAFCHROMIC EBT film measurements, and the calculated dose distribution from a commissioned treatment planning system (ECLIPSE). Isodose plots, dose profiles, gamma maps, and dose-volume histograms were used to evaluate the agreement. The isodose plots and dose profiles from the PRESAGE/optical-CT system were in excellent agreement with both the EBT measurements and the ECLIPSE calculation at all points except within 3 mm of the outer edge of the dosimeter where an edge artifact occurred. Excluding this 3 mm rim, gamma map comparisons show that all three distributions mutually agreed to within a 3% (dose difference) and 3 mm (distance-to-agreement) criteria. A 96% gamma pass ratio was obtained between the PRESAGE and ECLIPSE distributions over the entire volume excluding this rim. In conclusion, for the complex IMRT plan studied, and in the absence of inhomogeneities, the ECLIPSE dose calculation was found to agree with both independent measurements, to within 3%, 3 mm gamma criteria.
Figures
Similar articles
-
Comparison of an anthropomorphic PRESAGE® dosimeter and radiochromic film with a commercial radiation treatment planning system for breast IMRT: a feasibility study.J Appl Clin Med Phys. 2014 Jan 6;15(1):4531. doi: 10.1120/jacmp.v15i1.4531. J Appl Clin Med Phys. 2014. PMID: 24423854 Free PMC article.
-
Investigation of the feasibility of relative 3D dosimetry in the Radiologic Physics Center Head and Neck IMRT phantom using presage/optical-CT.Med Phys. 2009 Jul;36(7):3371-7. doi: 10.1118/1.3148534. Med Phys. 2009. PMID: 19673232 Free PMC article.
-
A practical three-dimensional dosimetry system for radiation therapy.Med Phys. 2006 Oct;33(10):3962-72. doi: 10.1118/1.2349686. Med Phys. 2006. PMID: 17089858 Free PMC article.
-
Three-dimensional dose verification for intensity modulated radiation therapy using optical CT based polymer gel dosimetry.Med Phys. 2006 May;33(5):1412-9. doi: 10.1118/1.2188820. Med Phys. 2006. PMID: 16752577
-
Fast, high-resolution 3D dosimetry utilizing a novel optical-CT scanner incorporating tertiary telecentric collimation.Med Phys. 2008 Jan;35(1):101-11. doi: 10.1118/1.2804616. Med Phys. 2008. PMID: 18293567 Free PMC article.
Cited by
-
Commissioning and benchmarking a 3D dosimetry system for clinical use.Med Phys. 2011 Aug;38(8):4846-57. doi: 10.1118/1.3611042. Med Phys. 2011. PMID: 21928656 Free PMC article.
-
Is It Possible to Publish a Calibration Function for Radiochromic Film?Int J Med Phys Clin Eng Radiat Oncol. 2014 Feb;3(1):25-30. doi: 10.4236/ijmpcero.2014.31005. Epub 2014 Jan 29. Int J Med Phys Clin Eng Radiat Oncol. 2014. PMID: 27642545 Free PMC article.
-
Comparison of an anthropomorphic PRESAGE® dosimeter and radiochromic film with a commercial radiation treatment planning system for breast IMRT: a feasibility study.J Appl Clin Med Phys. 2014 Jan 6;15(1):4531. doi: 10.1120/jacmp.v15i1.4531. J Appl Clin Med Phys. 2014. PMID: 24423854 Free PMC article.
-
Investigating the effect of a magnetic field on dose distributions at phantom-air interfaces using PRESAGE® 3D dosimeter and Monte Carlo simulations.Phys Med Biol. 2018 Feb 26;63(5):05NT01. doi: 10.1088/1361-6560/aaaca2. Phys Med Biol. 2018. PMID: 29393066 Free PMC article.
-
A 'quad-phantom' film dosimeter for use as a multi-planar verification tool for PRESAGE/optical-CT.J Phys Conf Ser. 2010;250(1):12097. doi: 10.1088/1742-6596/250/1/012097. J Phys Conf Ser. 2010. PMID: 21218141 Free PMC article.
References
-
- Molineu A., Hernandez N., Alvarez P., Followill D., and Ibbott G., “IMRT head and neck phantom irradiations: Correlation of results with institution size,” Med. Phys. 32, 1983–1984 (2005).
-
- Ibbott G. S., Molineu A., and Followill D. S., “Independent evaluations of IMRT through the use of an anthropomorphic phantom,” Technol. Cancer Res. Treat. 5, 481–487 (2006). - PubMed
-
- McJury M. et al. , “Radiation dosimetry using polymer gels: methods and applications,” Br. J. Radiol. 73, 919–929 (2000). - PubMed
Publication types
MeSH terms
Substances
Grants and funding
LinkOut - more resources
Full Text Sources
