. 2008 Aug 1;320(1):185-98.
doi: 10.1016/j.ydbio.2008.05.524. Epub 2008 May 20.

Retinoic acid regulates murine enteric nervous system precursor proliferation, enhances neuronal precursor differentiation, and reduces neurite growth in vitro

Affiliations

Retinoic acid regulates murine enteric nervous system precursor proliferation, enhances neuronal precursor differentiation, and reduces neurite growth in vitro

Yoshiharu Sato et al. Dev Biol. .

Abstract

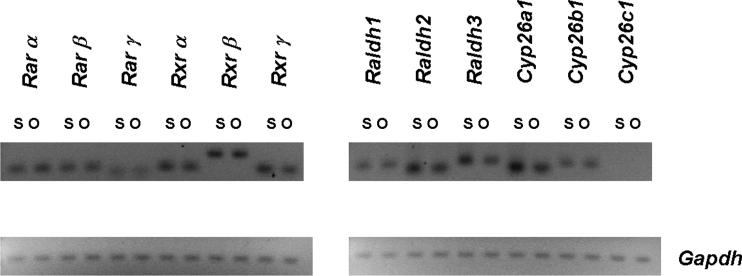
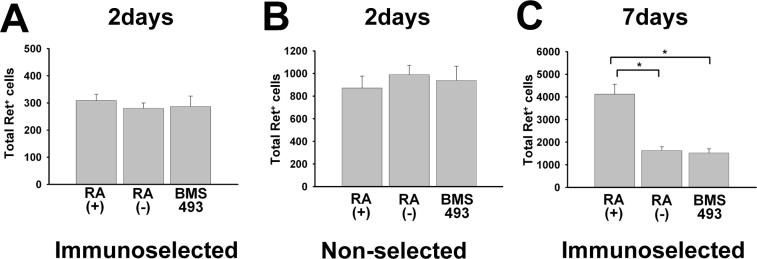
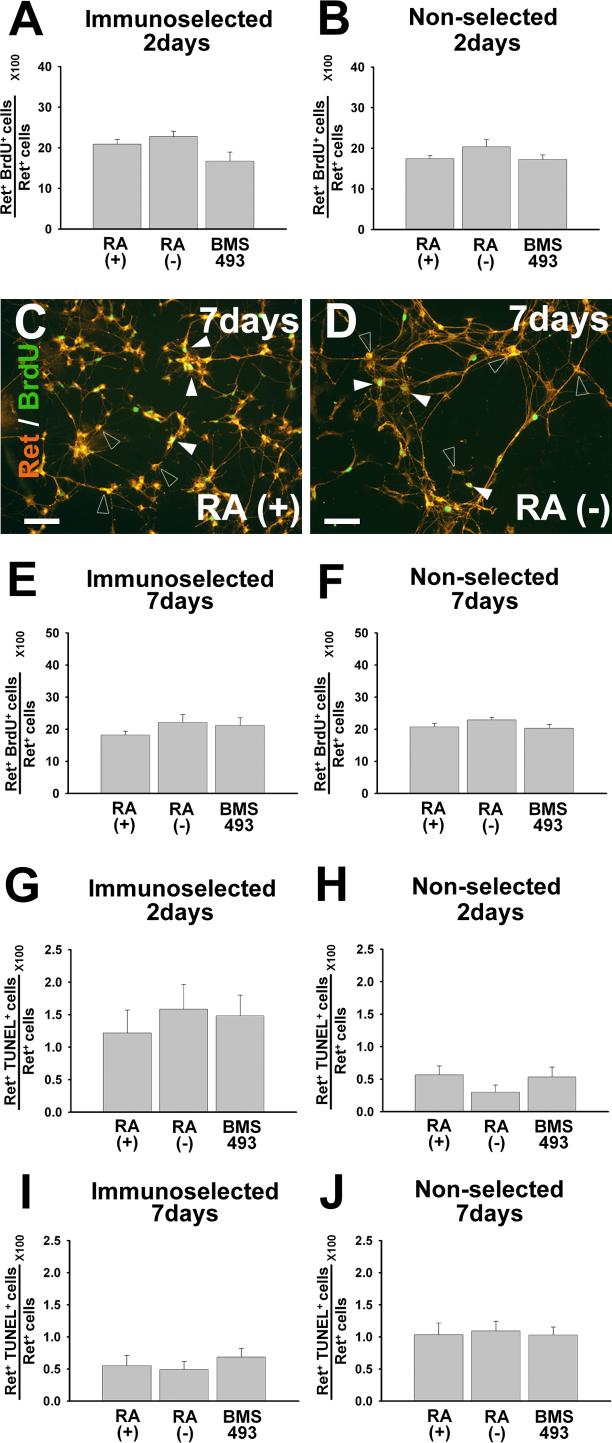
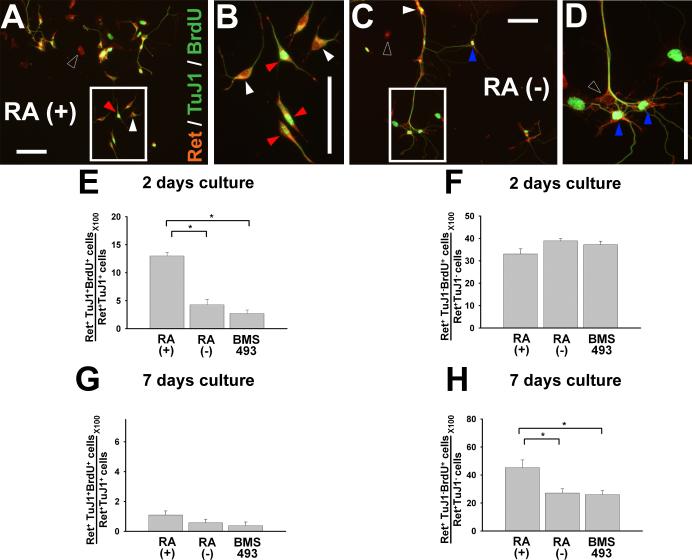
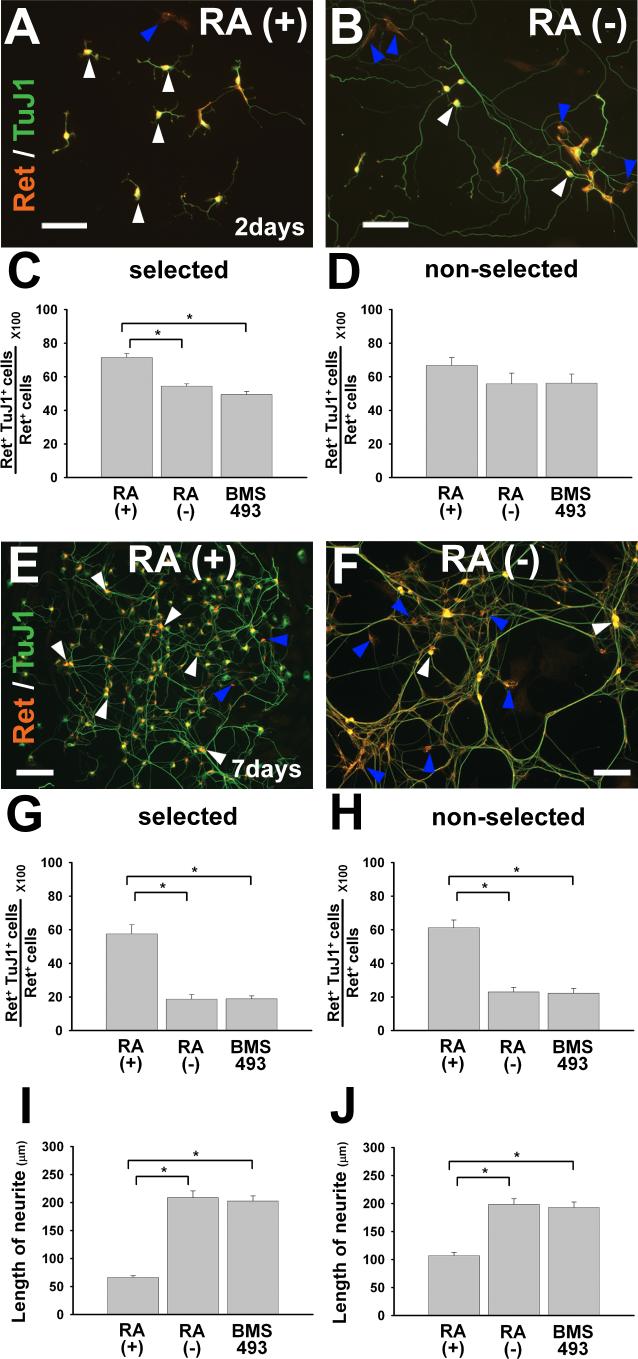
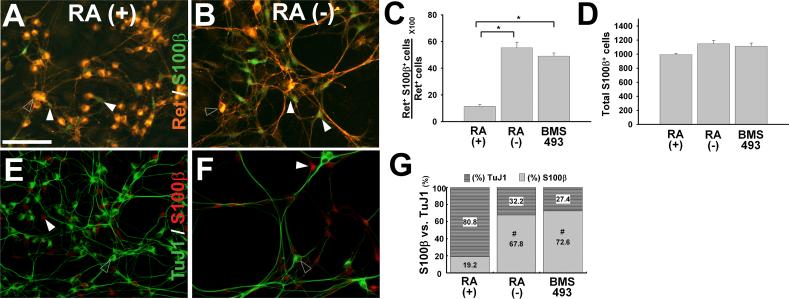
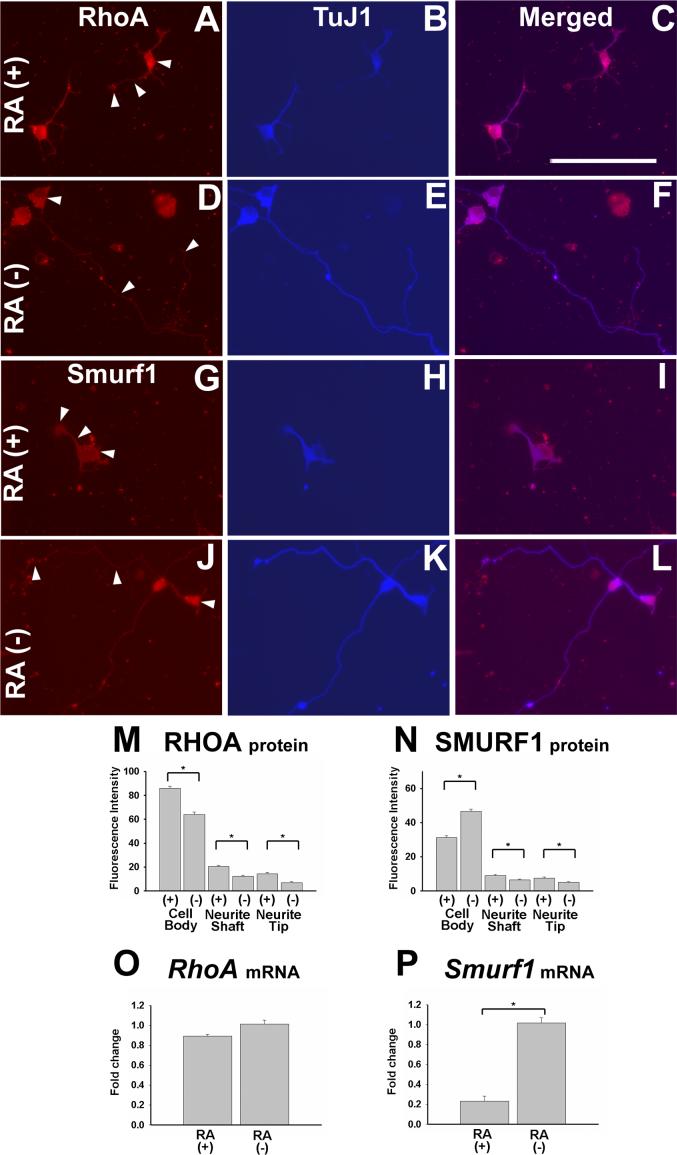
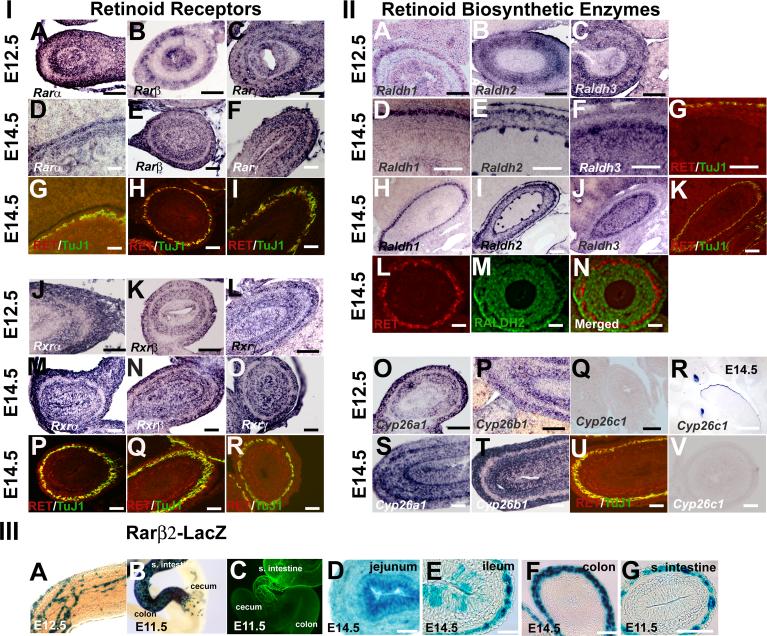
Enteric nervous system (ENS) precursors undergo a complex process of cell migration, proliferation, and differentiation to form an integrated network of neurons and glia within the bowel wall. Although retinoids regulate ENS development, molecular and cellular mechanisms of retinoid effects on the ENS are not well understood. We hypothesized that retinoids might directly affect ENS precursor differentiation and proliferation, and tested that hypothesis using immunoselected fetal ENS precursors in primary culture. We now demonstrate that all retinoid receptors and many retinoid biosynthetic enzymes are present in the fetal bowel at about the time that migrating ENS precursors reach the distal bowel. We further demonstrate that retinoic acid (RA) enhances proliferation of subsets of ENS precursors in a time-dependent fashion and increases neuronal differentiation. Surprisingly, however, enteric neurons that develop in retinoid deficient media have dramatically longer neurites than those exposed to RA. This difference in neurite growth correlates with increased RhoA protein at the neurite tip, decreased Smurf1 (a protein that targets RhoA for degradation), and dramatically decreased Smurf1 mRNA in response to RA. Collectively these data demonstrate diverse effects of RA on ENS precursor development and suggest that altered fetal retinoid availability or metabolism could contribute to intestinal motility disorders.


Figures

Figure 1
Figure 1
Many of the genes required to respond to RA and to synthesize or degrade RA are expressed in p75NTR antibody immunoselected cells from the E12.5 CF-1 mouse bowel. They are also expressed in the residual cells that were not selected with p75NTR antibody. Reverse transcriptase reactions were performed on freshly isolated cells to generate the cDNA templates for these studies. PCR amplification of Gapdh was used as a control to demonstrate similar levels of template abundance in the analyzed samples. With the exception of Cyp26c1, all of the genes investigated were expressed in the selected and non-selected cell populations. S = selected cells. O = “other cells” from the fetal bowel that were not immunoselected.
Figure 2
Figure 2
Retinoic acid (RA) increases Ret+ cells in culture after seven days, but this is not evident after 48 hours. E12.5 CF-1 mouse ENS precursors were maintained in culture either after immunoselection with an antibody to p75NTR (A, C) or without prior immunoselection (i.e., non-selected total gut culture) (B). ENS precursors were grown for 48 hr (A, B) or 7 days (C) in culture in the presence of GDNF plus RA, GDNF without RA, or GDNF plus BMS493. (A, B) There are no significant differences between any of these conditions after 48 hours in culture. (C) Quantitative analysis of total Ret+ cells after seven days demonstrated more Ret+ cells in RA treated cultures. N = three experiments/six separate wells. All Ret+ cells in each culture well were counted. *P < 0.01.
Figure 3
Figure 3
RA does not dramatically affect proliferation or death rates of Ret+ cells in culture when all Ret expressing cells are analyzed together. E12.5 CF-1 mouse p75NTR+ immunoselected (A, C, E, G, I) or non-selected (B, D, F, H, J) ENS precursors were maintained in culture for 48 hours or seven days before analysis. Cells were grown in the presence of GDNF plus RA, GDNF without RA, or GDNF plus BMS493. (C, D) Cultured cells were stained with antibodies to Ret and BrdU. Closed arrowheads point to Ret and BrdU double positive cells. Open arrowheads point to Ret expressing/BrdU negative cells. (A, B, E, F) Quantitative analysis of total Ret+ BrdU+ cells did not demonstrate any effect of RA on cell proliferation. (G-J) Quantitative analysis of total Ret+ TUNEL+ cells did not demonstrate any difference in cell death in response to RA. N = three experiments/six separate wells. At least 600 cells for each experiment were analyzed. *P < 0.01. Scale bars, 100 μm.
Figure 4
Figure 4
RA markedly enhances proliferation of immunoselected Ret+ TuJ1+ double positive cells after 48 hours in culture and increases proliferation of Ret+ TuJ1− cells after seven days in culture. E12.5 CF-1 mouse immunoselected (p75NTR expressing) ENS precursors were grown for 48 hours (A-F) or 7 days (G, H) in the presence of GDNF plus RA, GDNF without RA, or GDNF plus BMS493. (A-D) Representative images are shown. B and D are magnified views of the square regions in A and C respectively. Open arrowheads point to Ret single positive cells. White arrowheads point to RET and TuJ1 double positive cells. Blue arrowheads point to Ret and BrdU double positive cells. Red arrowheads point to Ret, TuJ1 and BrdU triple positive cells. Although both BrdU and TuJ1 staining employ green fluorescence, these are easily distinguished since BrdU is a nuclear antigen and TuJ1 antibody binds a cytoplasmic antigen. Quantitative analysis of cell proliferation for Ret+TuJ1+ (E) and Ret+TuJ1− (F) cells demonstrates that RA promotes proliferation of Ret and TuJ1 double positive cells after 2 days culture, however, this effect is not maintained after 7 days culture (G). (F) In contrast, RA has no effect on proliferation in the Ret+ TuJ1− population after 2 days culture, but increases proliferation of Ret+ TuJ1− cells after seven days in culture (H). All Ret+ cells in 2 days cultures were counted. At least 1800 cells per condition were analyzed for all figures from a total of 3 separate experiments. *P < 0.01. Scale bars, 100 μm.
Figure 5
Figure 5
RA induces neuronal differentiation of Ret+ cells and reduces neurite outgrowth. E12.5 CF-1 mouse ENS precursors were maintained in culture after immunoselecting p75NTR expressing cells (A-C, E-G, I) or without prior immunoselection (i.e., in mixed cell culture) (D, H, J). Cultures were analyzed after 48 hours (A-D, I, J) or 7 days (E-H) in the presence of GDNF plus RA, GDNF without RA, or GDNF plus BMS493. Representative images of cells after 2 days culture (A, B) or seven days in culture are shown (E, F). White arrowheads point to Ret and TuJ1 double positive cells. Blue arrowheads point to Ret positive/TuJ1 negative cells. (C, D) Quantitative analysis of neuronal differentiation as manifest by TuJ1+ immunoreactivity in Ret+ cells demonstrated that RA increased neuronal differentiation of immunoselected cells after 2 days in culture, but did not significantly increase neuronal differentiation in mixed (non-selected) cell cultures. However, (E-H) the percentage of Ret+ cells that were TuJ1 immunoreactive was significantly increased by RA after seven days in culture with or without immunoselection. (I, J) Quantitative analysis of neurite length in selected or non-selected cells. For Ret+ TuJ1 double labeling studies, > 1800 cells were evaluated for each condition from a total of three experiments. For neurite length studies, 600 cells for each condition were analyzed from a total of 3 experiments. *P < 0.01. Scale bars, 100 μm.
Figure 6
Figure 6
RA enhances neuronal lineage commitment but does not reduce glial lineage marker expression. E12.5 CF-1 mouse immunoselected (p75NTR expressing) ENS precursors were grown for seven days (A-G) in the presence of GDNF plus RA, GDNF without RA (−), or GDNF plus BMS493. Representative images of Ret and S100β (A, B), or TuJ1 and S100β (E,F) immunohistochemistry are shown. (C, D) Quantitative analysis of S100β expression in Ret+ cells was performed by counting all Ret+ and S100β+ cells in each well. These analyses demonstrated that RA reduces the percentage of Ret+ S100β+ cells (C), but does not reduce the total number of S100β+ cells per well. For these studies, all S100β+ cells in each well were counted (D). (G) Quantitative analysis of the ratio of S100β+ to TuJ1 immunoreactive cells was also performed by counting all TuJ1+ and S100β+ cells in each well. (A, B) Open arrowheads point to Ret+ cells. (E, F) Open arrowheads point to TuJ1+ cells. In all images, white arrowheads point to S100β cells. At least 1800 S100β+ cells per condition were analyzed from a total 3 separate experiments. *P < 0.01. Scale bars, 100 μ m.
Figure 7
Figure 7
Cells maintained in RA containing media have elevated levels of RhoA protein and reduced levels of Smurf1 compared to cells grown without RA. E12.5 CF1 mouse immunoselected (p75NTR expressing) ENS precursors were grown for 2 days in the presence of GDNF plus RA (A-C, G-I), or in GDNF without RA (D-F, J-L). Cultures were stained with antibodies to RhoA (A, D), Smurf1 (G, J) or TuJ1 (B, E, H, K). (C, F, I, L) Merged images. (M) RhoA or (N) Smurf1 immunofluorescence intensity in the cell body, axon shaft and axon tip was determined by quantitative image analysis. Arrowheads point to the location of fluorescence intensity measurements. 75 cells for each condition were analyzed from a total of 3 separate experiments. (O) RhoA and (P) Smurf1 mRNA levels were determined by qRT-PCR. Relative expression levels are shown. *P < 0.01. Scale bar, 100 μm.
Figure 8
Figure 8
Expression patterns for retinoid receptors and biosynthetic enzymes in the bowel wall at E12.5 and E14.5. Retinoid receptor (Section I: A-F, J-O) and retinoid biosynthetic enzyme (Section II: A-F, H, I,J, O-Q, S,T, V) gene expression was evaluated by in situ hybridization in the small bowel. At E14.5, adjacent sections of the bowel were also stained by immunohistochemistry with Ret and TuJ1 antibodies to demonstrate the position of the developing ENS (Section I: G-I, P-R; Section II: G, K, U). For Raldh2, protein expression was evaluated by double label immunohistochemistry with Ret (Section II: L, N) and Raldh2 (Section 2 M, N) antibodies. The immunohistochemical staining pattern for Raldh2 is similar to the in situ hybridization pattern for the same gene (Section II: E, I) and shows little overlap with Ret expression. Cyp26c1 was not detected in the bowel at E12.5 (Section II: Q) or E14.5 (Section II: V), but could be detected in developing teeth and the tongue surface at E14.5 in agreement with prior reports (Tahayato et al., 2003) demonstrating the probe specificity and sensitivity (Section II: R). Section III shows gene expression patterns for β-galactosidase in Rarβ2-LacZ transgenic mice that produce β-galactosidase from the Rarb promoter. (Section III: A, B) Images show whole mount staining patterns in the mid-colon at E12.5 (A) and at the ileocecal junction at E11.5 (B). These patterns are typical of the pattern of ENS precursors within the bowel at these ages. For comparison, TuJ1 immunoreactive cells at E11.5 are shown (C) at the ileocecal junction. (Section III: D-G) Sections of the bowel were obtained in the jejunum (D), ileum (E), and colon (F) at E14.5 demonstrating that the pattern of β-galactosidase expression varies along the length of the bowel at this age. (Section III: G) shows strong β-galactosidase expression in the small bowel in the region of the ENS at E11.5 consistent with the whole mount staining patterns. Scale bars, 50 μm. Because of common usage, we used Greek symbols for retinoid receptor gene names in this figure. Rarα = Rara, Rarβ = Rarb, Rarγ = Rarg, Rxrα = Rxrg, Rxrβ = Rxrb, and Rxrγ = Rxrg

Similar articles

Cited by

References

    1. Baldassarre G, Boccia A, Bruni P, Sandomenico C, Barone MV, Pepe S, Angrisano T, Belletti B, Motti ML, Fusco A, Voglietto G. Retinoic acid induces neuronal differentiation of embryonal carcinoma cells by reducing proteasome-dependent proteolysis of the cyclin-dependent inhibitor p27. Cell Growth and Differentiation. 2000;11:517–526. - PubMed
    1. Barlow A, de Graaff E, Pachnis V. Enteric nervous system progenitors are coordinately controlled by the G protein-coupled receptor EDNRB and the receptor tyrosine kinase RET. Neuron. 2003;40:905–16. - PubMed
    1. Berggren K, McCaffery P, Drager U, Forehand CJ. Differential distribution of retinoic acid synthesis in the chicken embryo as determined by immunolocalization of the retinoic acid synthetic enzyme, RALDH-2. Dev Biol. 1999;210:288–304. - PubMed
    1. Bixby S, Kruger GM, Mosher JT, Joseph NM, Morrison SJ. Cell-intrinsic differences between stem cells from different regions of the peripheral nervous system regulate the generation of neural diversity. Neuron. 2002;35:643–56. - PubMed
    1. Blomhoff R, Blomhoff HK. Overview of retinoid metabolism and function. J Neurobiol. 2006;66:606–30. - PubMed

Publication types

MeSH terms