. 2008 Oct;36(10):1236-43.
doi: 10.1016/j.exphem.2008.04.012. Epub 2008 Jun 17.

Enrichment of hematopoietic stem cells with SLAM and LSK markers for the detection of hematopoietic stem cell function in normal and Trp53 null mice

Affiliations

Enrichment of hematopoietic stem cells with SLAM and LSK markers for the detection of hematopoietic stem cell function in normal and Trp53 null mice

Jichun Chen et al. Exp Hematol. 2008 Oct.

Abstract

Objective: To test function of hematopoietic stem cells (HSCs) in vivo in C57BL/6 (B6) and Trp53-deficient (Trp53 null) mice by using two HSC enrichment schemes.

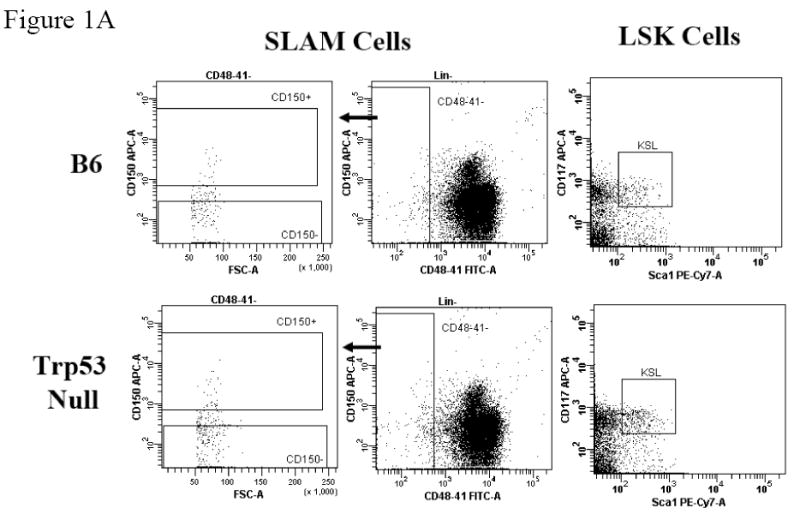
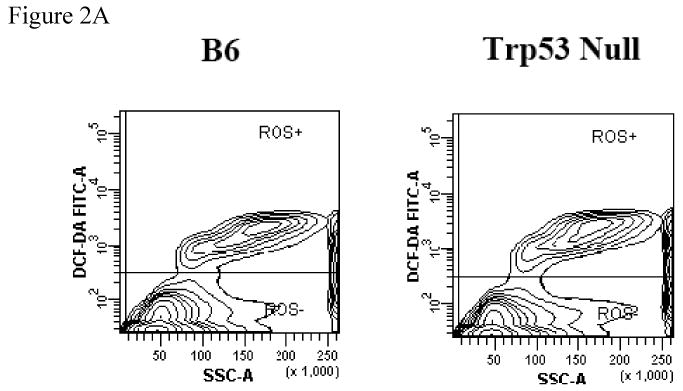
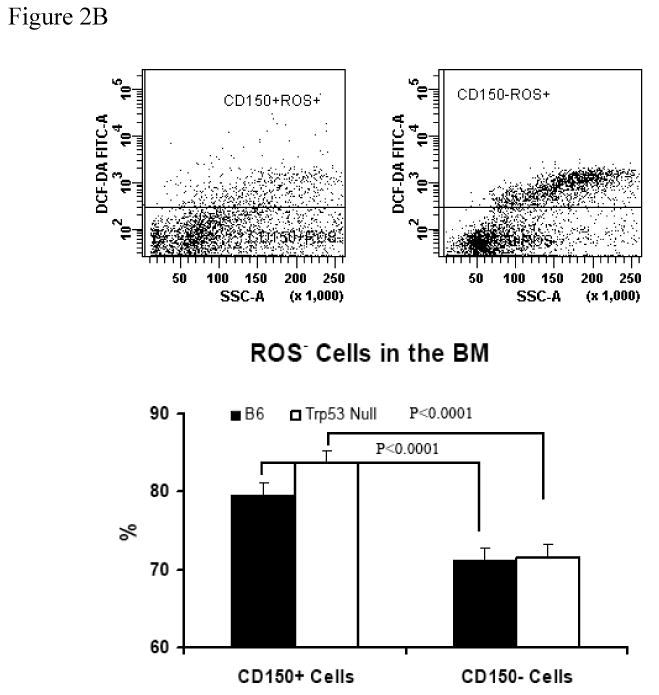
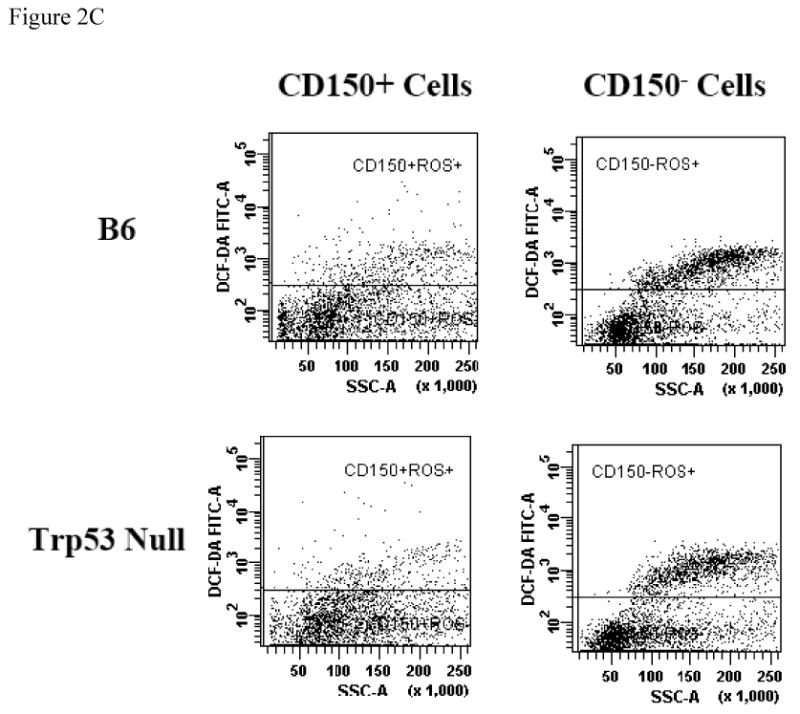
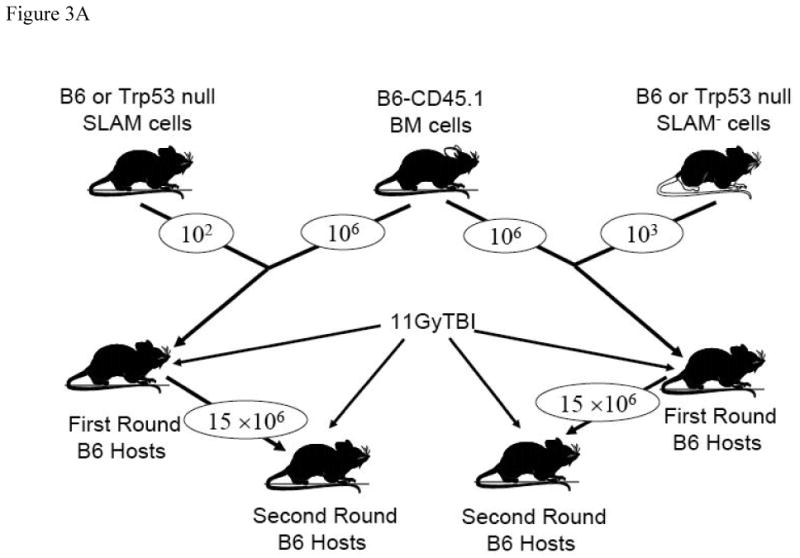
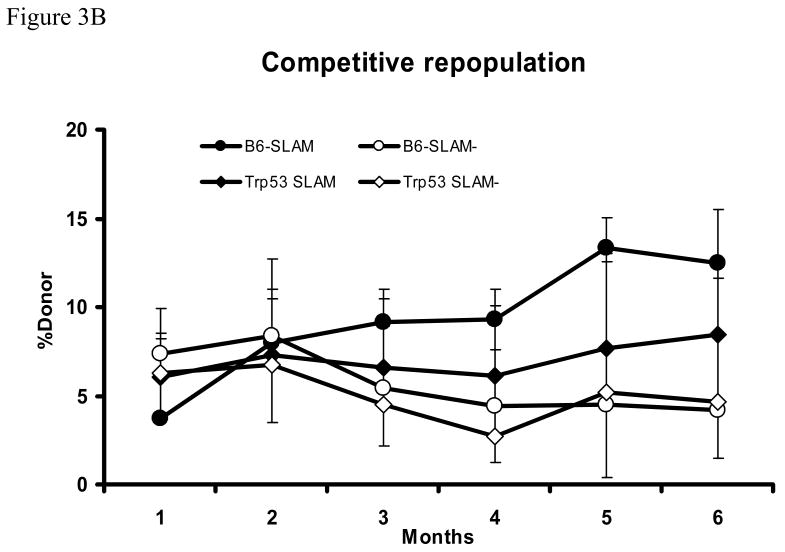
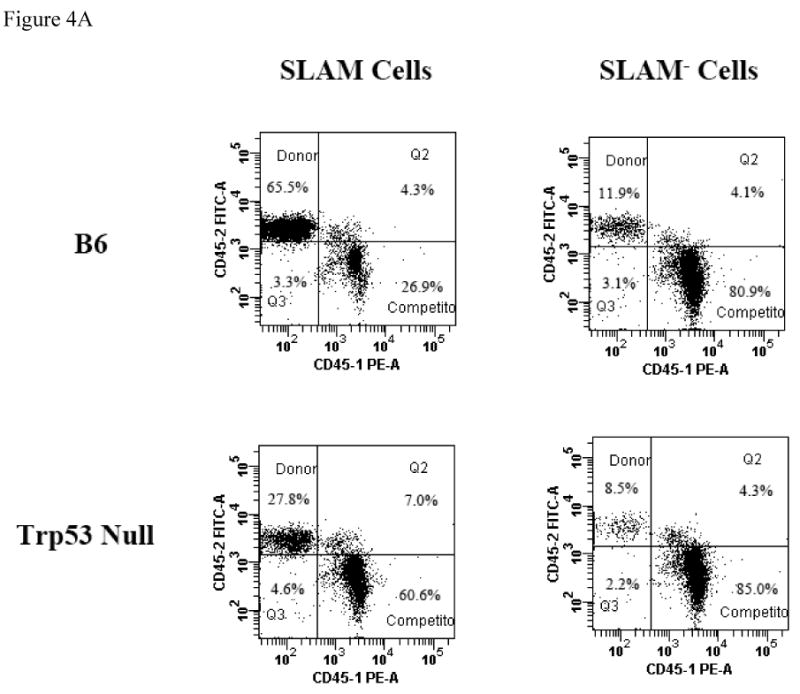
Materials and methods: Bone marrow (BM) Lin-CD41-CD48-CD150+ (signaling lymphocyte activation molecules [SLAM]), Lin-CD41-CD48-CD150- (SLAM-) and Lin-Sca1+CD117+ (LSK) cells were defined by fluorescence-activated cell staining (FACS). Cellular reactive oxygen species (ROS) level was also analyzed by FACS. Sorted SLAM, SLAM-, and LSK cells were tested in vivo in the competitive repopulation (CR) and serial transplantation assays.

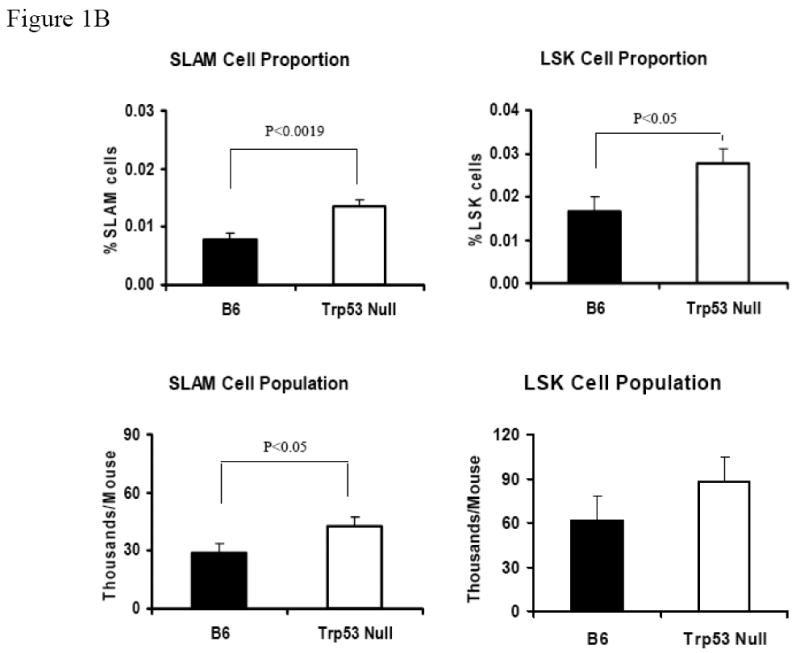
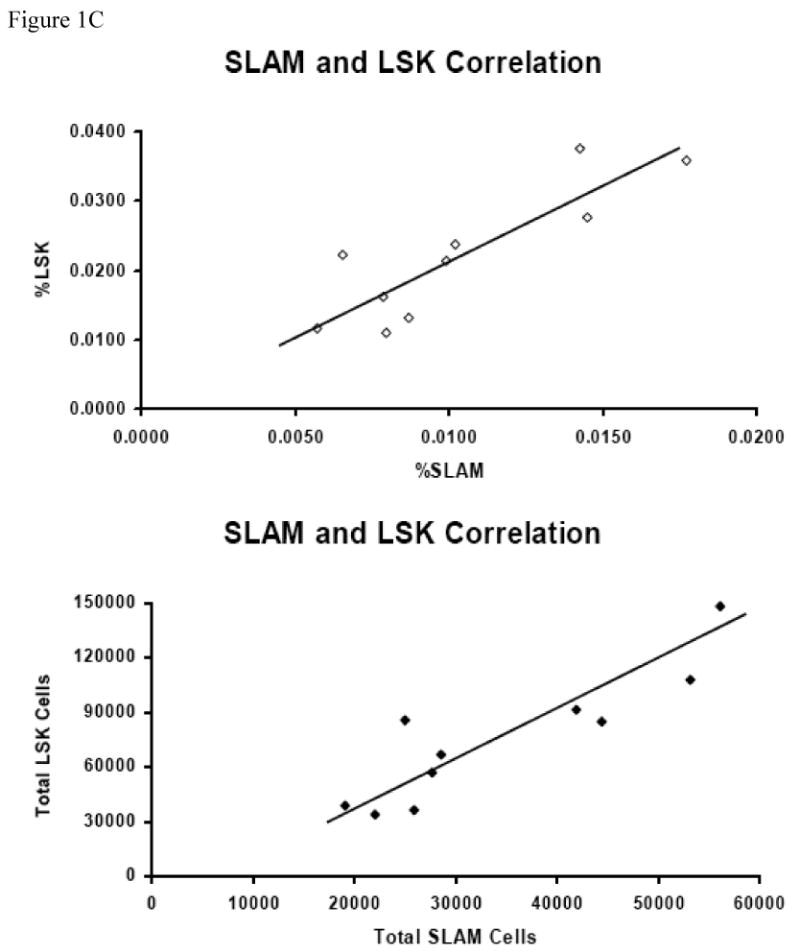
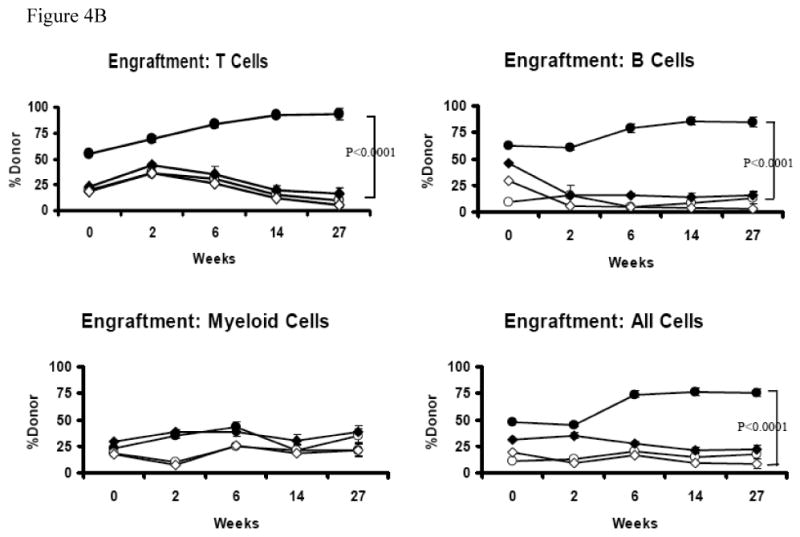
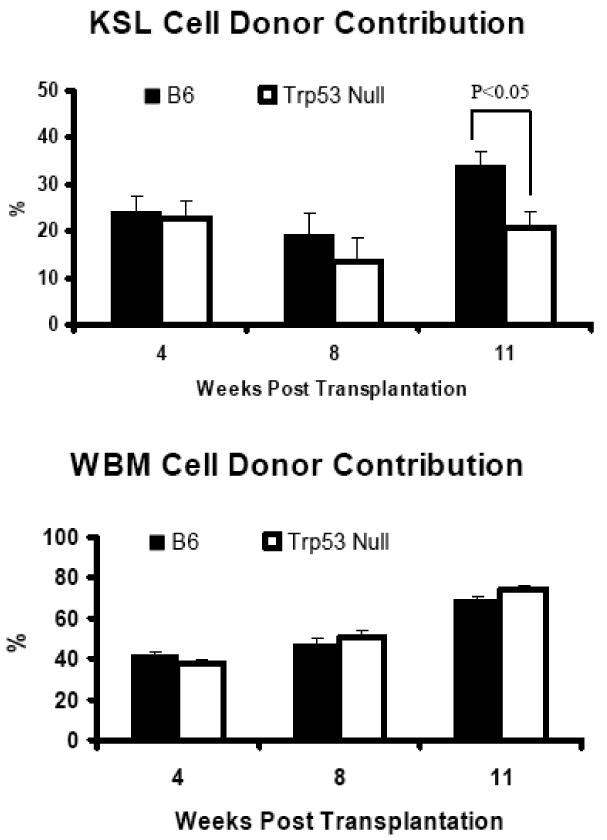
Results: SLAM cell fraction was 0.0078%+/-0.0010% and 0.0135%+/-0.0010% of total BM cells in B6 and Trp53 null mice, and was highly correlated (R2=0.7116) with LSK cells. CD150+ BM cells also contained more ROSlow cells than did CD150- cells. B6 SLAM cells repopulated recipients much better than B6 SLAM- cells, showing high HSC enrichment. B6 SLAM cells also engrafted recipients better than Trp53 null SLAM cells in the CR and the follow-up serial transplantation assays. Similarly, LSK cells from B6 donors also had higher repopulating ability than those from Trp53 null donors. However, whole BM cells from the same B6 and Trp53 null donors showed the opposite functional trend in recipient engraftment.

Conclusion: Both SLAM and LSK marker sets can enrich HSCs from B6 and Trp53 mice. Deficiency of Trp53 upregulates HSC self-renewal but causes no gain of HSC function.


Figures

Figure 1
Figure 1. BM Lin-CD41-CD48-CD150+ SLAM cells and Lin-Sca1+c-Kit+ LSK cells in B6 and Trp53 null mice
BM cells from five B6 and five Trp53 null mice were stained with antibody cocktails containing CD41-FITC + CD48-FITC + Lin (CD3, CD4, CD8, CD11b CD45R, Gr1, Ter119)-PE + CD150-APC, or Lin-PE + Sca1-PE-Cy7 + CD117-APC, respectively. Lin-CD41-CD48- cells were gated to show CD150 expression for SLAM cells while Lin- cells were gated to show Sca1 and CD117 expressions for LSK cells (A). Proportions and total numbers of BM SLAM and LSK cells were higher in Trp53 null mice than in B6 mice (B). SLAM and LSK cells are highly correlated in percentage (R2 = 0.7116) as well as in total cell number (R2 = 0.7705) (C).
Figure 2
Figure 2. BM cell ROS content
BM cells from five B6 and five Trp53 null mice were incubated with DCF-DA along with an anti-CD150 antibody to measure reactive oxygen species (ROS). Proportion of ROSlow cells was similar between B6 and Trp53 null mice (A). Proportion of ROSlow cells was significantly higher in CD150+ than in CD150- cells in both B6 and Trp53 null mice. Data were shown as means with standard errors (B), or as representative dot plots (C).
Figure 3
Figure 3. Repopulation of SLAM and SLAM- BM cells
Sorted SLAM and SLAM- BM cells from B6 and Trp53 null donors were mixed 102 : 106 and 103 : 106 respectively with unfractionated BM cells from a pool of B6-CD45.1 congenic mice, and the cell mixtures were then injected into lethally-irradiated (11 Gy TBI) B6 recipients at four recipients per donor cell type (A). Engraftments of donor cells in lethally-irradiated recipient from one to six months were shown as averages with standard errors (B).
Figure 4
Figure 4. Serial transplantation
BM cells from the competitive repopulation recipients were obtained at six and a half months following the initiate reconstitution. BM cells from one recipient of each of the four original donor groups (B6 SLAM, B6 SLAM-, Trp53 null SLAM, and Trp53 null SLAM-) that had the highest donor engraftment were re-transplanted into new lethally-irradiated (11 Gy TBI) B6 secondary recipients at three recipients each type, with each recipient receiving 15 × 106 cells. Engraftment of original donor and competitor cells was measured at two, six, fourteen and twenty-seven weeks after secondary transplantation. Data shown are representatives (A) and average donor contributions with standard errors from three recipient mice used for each donor group (B).
Figure 5
Figure 5. Reconstitution of LSK cells
Sorted LSK cells from B6 and Trp53 null mice were mixed 1:300 with B6-CD45.1 congenic BM cells and injected into lethally irradiated (11 Gy TBI) B6 recipients at six recipients per donor type. Unfractionated WBM cells from the same B6 and Trp53 null donors were mixed 1:1 with B6-CD45.1 competitor cells and injected to similar recipients at four recipients per donor type. Donor contributions were measured at four, eight and eleven weeks after transplantation. Data presented as means with standard errors.

Similar articles

Cited by

References

    1. Chen J, Astle CM, Harrison DE. Development and aging of primitive hematopoietic stem cells in BALB/cBy mice. Exp Hematol. 1999;27:928–935. - PubMed
    1. Harrison DE, Astle CM, Stone M. Numbers and functions of transplantable primitive immunohematopoietic stem cells. Effects of age. J Immunol. 1989;142(11):3833–3840. - PubMed
    1. Hellman S, Botnick LE, Hannon EC, Vigneulle RM. Proliferative capacity of murine hematopoietic stem cells. Proc Natl Acad Sci U S A. 1978;75(1):490–494. - PMC - PubMed
    1. Kiel MJ, Yilmaz OH, Iwashita T, Yilmaz OH, Terhorst C, Morrison SJ. SLAM family receptors distinguish hematopoietic stem and progenitor cells and reveal endothelial niches for stem cells. Cell. 2005;121(7):1109–1121. - PubMed
    1. Yuan R, Astle CM, Chen J, Harrison DE. Genetic regulation of hematopoietic stem cell exhaustion during development and growth. Exp Hematol. 2005;33(2):243–250. - PubMed

MeSH terms

Substances