. 2008 Jun 24;105(25):8718-23.
doi: 10.1073/pnas.0803526105. Epub 2008 Jun 18.

Apolipoprotein (apo) E4 enhances HIV-1 cell entry in vitro, and the APOE epsilon4/epsilon4 genotype accelerates HIV disease progression

Affiliations

Apolipoprotein (apo) E4 enhances HIV-1 cell entry in vitro, and the APOE epsilon4/epsilon4 genotype accelerates HIV disease progression

Trevor D Burt et al. Proc Natl Acad Sci U S A. .

Abstract

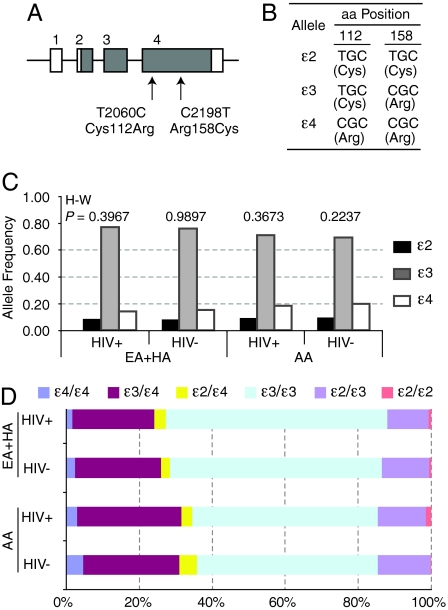
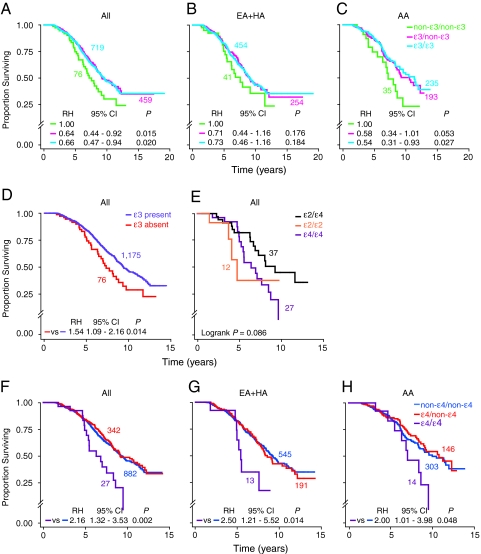
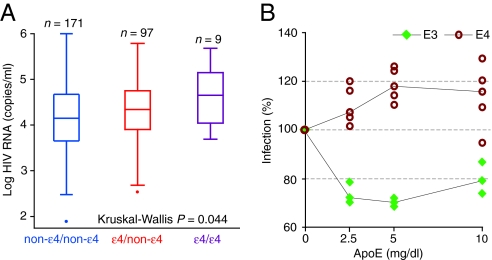
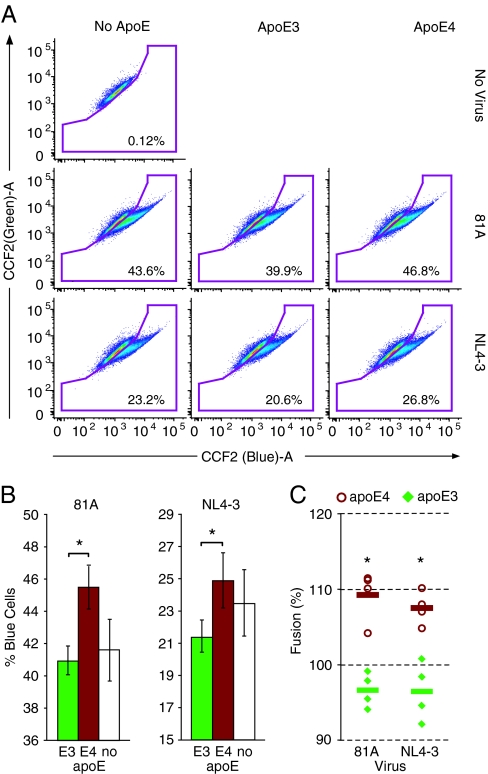
Originally recognized for their role in lipoprotein metabolism and cardiovascular disease, apolipoprotein (apo) E isoforms (apoE2, apoE3, and apoE4) have also been implicated to play a key role in several biological processes not directly related to their lipid transport function. For example, apoE4 contributes significantly to neurodegeneration in Alzheimer's disease. However, the role of apoE in infectious diseases is less well defined. Here, by examining a large cohort of HIV(+) European and African American subjects, we found that the APOE epsilon4/epsilon4 genotype is associated with an accelerated disease course and especially progression to death compared with the APOE epsilon3/epsilon3 genotype. However, an association between the epsilon4/epsilon4 genotype and HIV-associated dementia (HAD), a neurological condition with clinicopathological features similar to Alzheimer's disease, was not detected. Consistent with the genotype-phenotype relationships observed, compared with recombinant apoE3, apoE4 enhanced HIV fusion/cell entry of both R5 and X4 HIV strains in vitro. These findings establish apoE as a determinant of HIV-AIDS pathogenesis and raise the possibility that current efforts to convert apoE4 to an "apoE3-like" molecule to treat Alzheimer's disease might also have clinical applicability in HIV disease.


Conflict of interest statement

The authors declare no conflict of interest.

Figures

Fig. 1.
Fig. 1.
APOE gene structure, APOE polymorphisms, and frequency of the APOE alleles and genotypes in HIV+ and HIV-negative subjects from WHMC. (A) Schema of APOE gene structure. The numbers above the boxes indicate exons. Gray, coding region; white, untranslated region. Arrows, position of the two SNPs [and corresponding amino acid (aa) changes] genotyped. (B) APOE alleles. The two SNPs are in strong linkage disequilibrium and result in three APOE alleles (ε2, ε3, and ε4). The corresponding amino acids are in parentheses. (C and D) Distribution of the APOE (C) alleles and (D) genotypes in the WHMC HIV-positive (HIV+) and HIV-negative (HIV−) subjects. EA, European American; HA, Hispanic American; AA, African American. The numbers at the top of the bars in C represent significance values for the test of Hardy–Weinberg (H–W) equilibrium. χ2 = 17.37 and P = 0.0002 for differences in the APOE allele frequencies in subjects of European (EA+HA) vs. African (AA) descent.
Fig. 2.
Fig. 2.
APOE alleles and genotypes influence the rate of disease progression in HIV-infected subjects from the WHMC cohort. Kaplan–Meier plots depict the association between the indicated APOE alleles/genotypes and rate of progression to death. (A, D–F) Kaplan-Meier plots for HIV+ subjects from the entire WHMC HIV+ cohort; (B and G) subjects of European (EA+HA) descent; (C and H) subjects of AA descent. P values in E are by log-rank test, whereas in the other plots they were obtained by Cox proportional hazard regression models. RH, relative hazard; CI, confidence interval. Color-coded numbers adjacent to each plot are the corresponding number of subjects in each genotypic group.
Fig. 3.
Fig. 3.
Influence of the ε4 allele on the steady-state viral load in the WHMC HIV+ cohort, and apoE3 or apoE4 isoforms on HIV infection in vitro. (A). Box-and-whisker plot shows the distribution of the steady-state viral load according to APOE genotype. The overall difference among the genotypes was assessed by using the Kruskal–Wallis test (n) number of subjects. (B) Influence of apoE isoforms on HIV infection in vitro. MAGI-R5 cells (2 × 10⁵) were infected with luciferase-pseudotyped HIV bearing NL4–3 gp120 after incubation for 2 h with apoE3 or apoE4 at the indicated concentrations. Luciferase activity (reflecting gene expression from integrated provirus) was measured 3 days later. Each analysis was conducted in replicates of three or five, and the results were calculated as a percentage of the untreated control (the median value of the mock-treated samples). Significance was determined by Student's t test, and P values for significance between the effects of apoE3 and apoE4 isoforms were <0.001 at each concentration tested.
Fig. 4.
Fig. 4.
Influence of apoE isoforms on fusion of HIV to the cell membrane. (A) Flow cytograms from a representative experiment. Shown are examples of results from uninfected (No virus, Top) and untreated (No apoE, Left) controls and infection with 81A (Middle) or NL4–3 (Bottom) HIV strains following pretreatment with apoE3 (Middle) or apoE4 (Right). SupT1-CCR5 cells that have undergone fusion show increased blue fluorescence, and the percentage of cells included in the “fusion” gate are noted in the lower right-hand corner. Each plot represents a single well from each treatment. (B) Histograms representing the results for 81A and NL4-3 infection demonstrate the mean percent of blue cells per well and standard deviation for the experiment shown in A. Samples were run in triplicate, and significance values were determined by Student's t test; *, P < 0.05. (C) Comparison of data from four individual experiments. Results were calculated as a percentage of the untreated control, using the mean value of the mock-treated samples as the untreated control [(mean of experimental group/mean of untreated control group) × 100%]. These results demonstrate that 81A and NL4-3 infection in the presence of apoE4 (open circles) reproducibly resulted in significantly higher levels of fusion/infection than in the presence of apoE3 (closed diamonds). The horizontal bars represent the mean value for data points. Significance was determined by Student's t test; *, P < 0.01.

Comment in

Similar articles

Cited by

References

    1. Kaslow RA, Dorak T, Tang JJ. Influence of host genetic variation on susceptibility to HIV type 1 infection. J Infect Dis. 2005;191:S68–S77. - PubMed
    1. Fatkenheuer G, et al. Efficacy of short-term monotherapy with maraviroc, a new CCR5 antagonist, in patients infected with HIV-1. Nat Med. 2005;11:1170–1172. - PubMed
    1. Manes S, et al. CCR5 expression influences the progression of human breast cancer in a p53-dependent manner. J Exp Med. 2003;198:1381–1389. - PMC - PubMed
    1. Glass WG, et al. CCR5 deficiency increases risk of symptomatic West Nile virus infection. J Exp Med. 2006;203:35–40. - PMC - PubMed
    1. Mahley RW, Rall SC., Jr Apolipoprotein E: Far more than a lipid transport protein. Annu Rev Genomics Hum Genet. 2000;1:507–537. - PubMed

Substances