

Multi-state models for the analysis of time-to-event data
- PMID: 18562394
- PMCID: PMC2692556
- DOI: 10.1177/0962280208092301
Multi-state models for the analysis of time-to-event data
Abstract
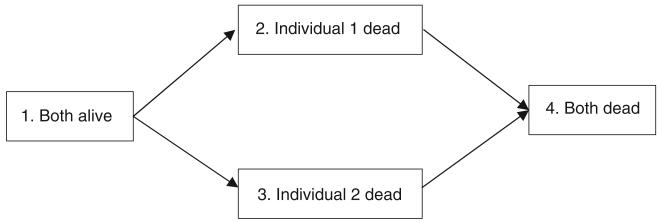
The experience of a patient in a survival study may be modelled as a process with two states and one possible transition from an "alive" state to a "dead" state. In some studies, however, the "alive" state may be partitioned into two or more intermediate (transient) states, each of which corresponding to a particular stage of the illness. In such studies, multi-state models can be used to model the movement of patients among the various states. In these models issues, of interest include the estimation of progression rates, assessing the effects of individual risk factors, survival rates or prognostic forecasting. In this article, we review modelling approaches for multi-state models, and we focus on the estimation of quantities such as the transition probabilities and survival probabilities. Differences between these approaches are discussed, focussing on possible advantages and disadvantages for each method. We also review the existing software currently available to fit the various models and present new software developed in the form of an R library to analyse such models. Different approaches and software are illustrated using data from the Stanford heart transplant study and data from a study on breast cancer conducted in Galicia, Spain.
Figures


References
-
- Andersen PK, Abildstrom SZ, Rosthøj S. Competing risks as a multi-state model. Statistical Methods in Medical Research. 2002;11:203–15. - PubMed
-
- Hougaard P. Analysis of multivariate survival data. Springer; 2000.
-
- Klein JP, Moeschberger ML. Survival analysis: techniques for censored and truncated data. Springer; 2003.
-
- Commenges D. Inference for multi-state models from interval-censored data. Statistical Methods in Medical Research. 2002;11:167–82. - PubMed
-
- Andersen PK, Borgan O, Gill RD, Keiding N. Statistical models based on counting processes. Springer; 1993.
Publication types
MeSH terms
Grants and funding
LinkOut - more resources
Full Text Sources
Other Literature Sources
