. 2008 Aug;295(2):C365-77.
doi: 10.1152/ajpcell.00449.2007. Epub 2008 Jun 18.

Pregnancy-upregulated nonubiquitous calmodulin kinase induces ligand-independent EGFR degradation

Affiliations

Pregnancy-upregulated nonubiquitous calmodulin kinase induces ligand-independent EGFR degradation

Tushar B Deb et al. Am J Physiol Cell Physiol. 2008 Aug.

Abstract

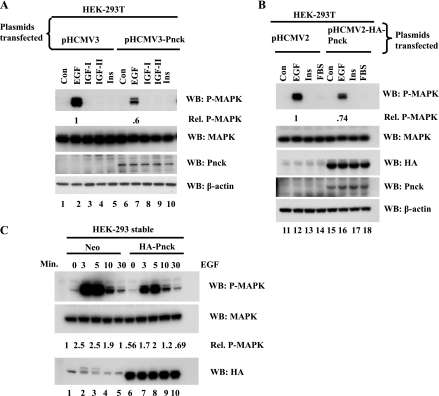
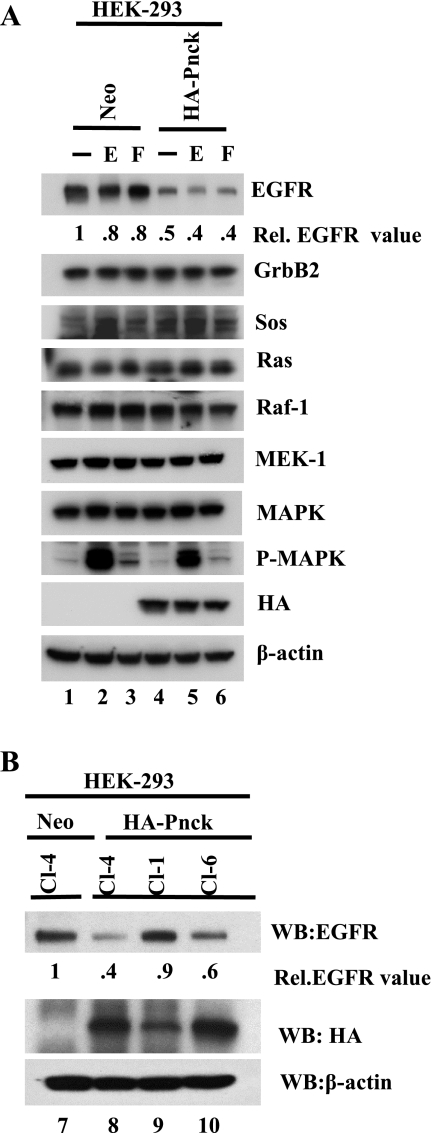
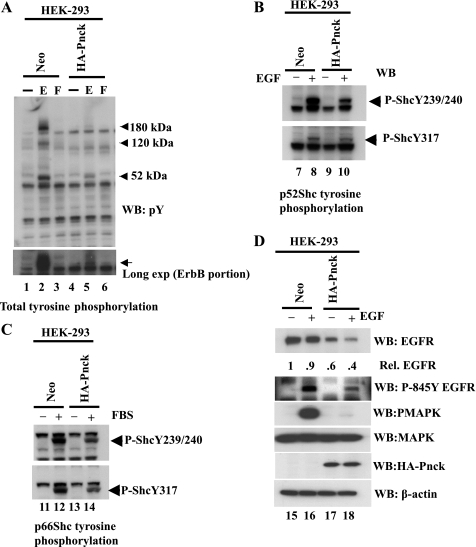
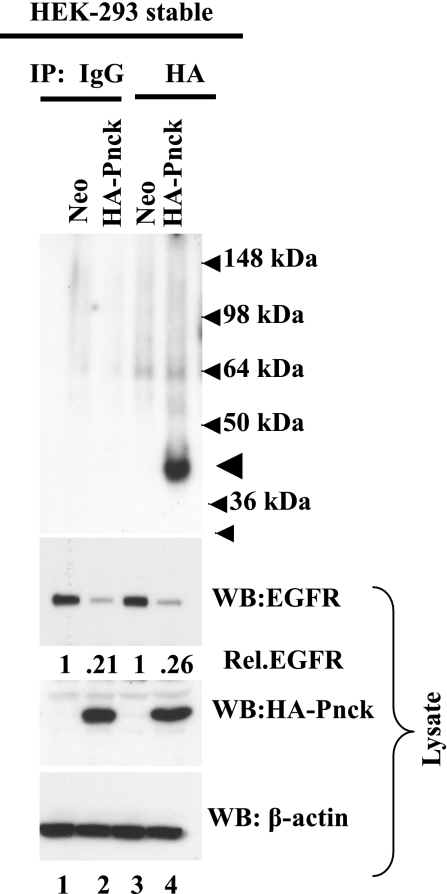
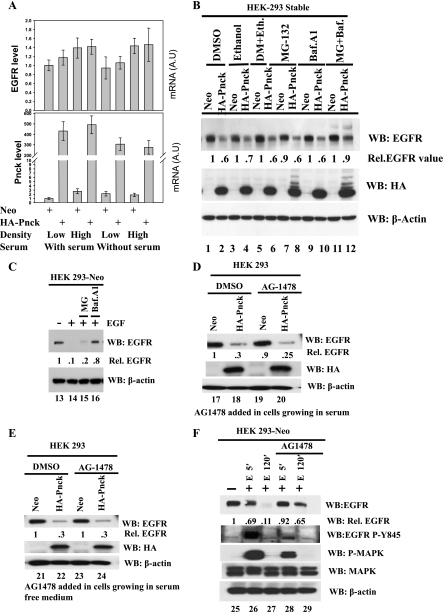
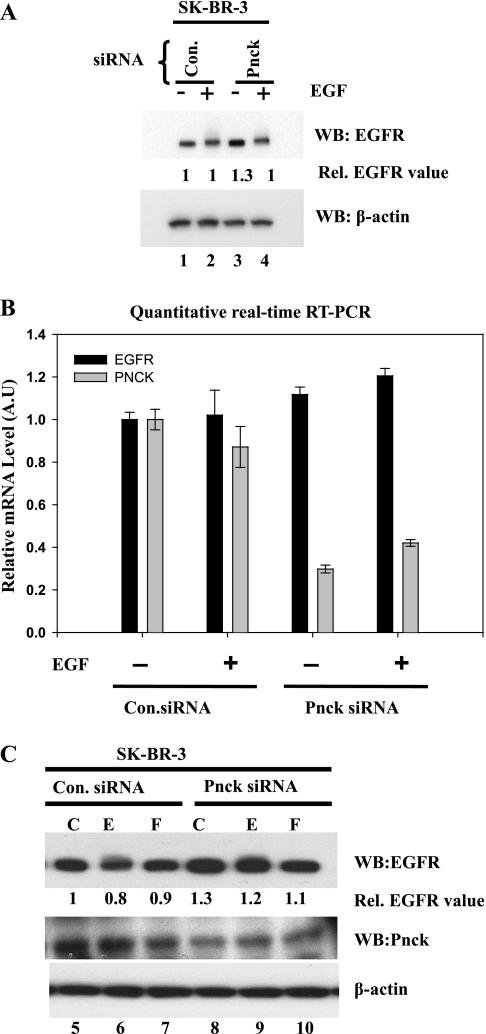
We describe here an important function of the novel calmodulin kinase I isoform, pregnancy-upregulated nonubiquitous calmodulin kinase (Pnck). Pnck (also known as CaM kinase Ibeta(2)) was previously shown to be differentially overexpressed in a subset of human primary breast cancers, compared with benign mammary epithelial tissue. In addition, during late pregnancy, Pnck mRNA was shown to be strongly upregulated in epithelial cells of the mouse mammary gland exhibiting decreased proliferation and terminal differentiation. Pnck mRNA is also significantly upregulated in confluent and serum-starved cells, compared with actively growing proliferating cells (Gardner HP, Seung HI, Reynolds C, Chodosh LA. Cancer Res 60: 5571-5577, 2000). Despite these suggestive data, the true physiological role(s) of, or the signaling mechanism(s) regulated by Pnck, remain unknown. We now report that epidermal growth factor receptor (EGFR) levels are significantly downregulated in a ligand-independent manner in human embryonic kidney-293 (HEK-293) cells overexpressing Pnck. MAP kinase activation was strongly inhibited by EGFR downregulation in the Pnck-overexpressing cells. The EGFR downregulation was not the result of reduced transcription of the EGFR gene but from protea-lysosomal degradation of EGFR protein. Knockdown of endogenous Pnck mRNA levels by small interfering RNA transfection in human breast cancer cells resulted in upregulation of unliganded EGFR, consistent with the effects observed in the overexpression model of Pnck-mediated ligand-independent EGFR downregulation. Pnck thus emerges as a new component of the poorly understood mechanism of ligand-independent EGFR degradation, and it may represent an attractive therapeutic target in EGFR-regulated oncogenesis.


Figures

Fig. 1.
Fig. 1.
Pregnancy-upregulated nonubiquitous calmodulin kinase (Pnck) inhibits EGF-induced MAP kinase activation in human embryonic kidney (HEK)-293T cells. A: inhibition of EGF-induced MAP kinase activity by wild-type (WT) Pnck. Subconfluent HEK-293T cells were transiently transfected with control plasmid phCMV3 (lanes 15) or WT Pnck cDNA in phCMV3 (lanes 610). Following transfection, cells were allowed to grow for 24 h and were then serum starved for another 24 h in DMEM containing 10 mM HEPES, pH 7.4. Plates were stimulated in serum-free medium at room temperature either without any ligand [control (Con), lanes 1 and 6] or with the following ligands: 10 nM EGF for 3 min (lanes 2 and 7), 50 ng/ml IGF-I for 5 min (lanes 3 and 8), 50 ng/ml IGF-II for 5 min (lanes 4 and 9), and 100 μM insulin (Ins) for 5 min (lanes 5 and 10). Lysates were prepared, protein concentration was determined, and equal amounts of protein were resolved on a 12% SDS-PAGE gel and transferred onto a polyvinylidene difluoride (PVDF) membrane. The polyclonal antibody (PAb) membrane was immunoblotted with anti-phospho-MAP kinase (Thr202/Tyr204) PAb [Western blot (WB): P-MAPK], anti-pan-ERK monoclonal antibody (MAb; WB: MAPK), or polyclonal Pnck antibodies (WB: Pnck) and anti-β-actin antibodies (WB: β-actin). EGF-induced phospho-MAPK band densities were normalized to MAPK, and EGF-induced phospho-MAPK density in Pnck-overexpressing cells is presented relative (Rel) to identical treatment in control vector-transfected cells. Experiment was repeated three times with identical results. B: EGF-induced MAP kinase inhibition by hemagglutinin (HA)-Pnck. HEK-293T cells were transiently transfected with control plasmid phCMV2 (lanes 1114) or HA-Pnck cDNA expressing phCMV2 plasmid (lanes 1518). Cells were processed as described in A and were stimulated either without any ligand (Con, lanes 11 and 15) or by EGF (lanes 12 and 16), insulin (lanes 13 and 17), or by 20% fetal bovine serum (FBS) for 10 min (lanes 14 and 18) at room temperature. Lysates were immunoblotted for phospho-MAP kinase (WB: P-MAPK), MAP kinase (WB: MAPK), HA-tagged Pnck (WB: HA), Pnck (WB: Pnck), and for β-actin (WB: β-actin). EGF-induced phospho-MAPK band densities were normalized to MAPK, and EGF-induced phospho-MAPK density in Pnck-overexpressing cells is presented relative to identical treatment in control vector-transfected cells. The experiment was repeated four times with essentially identical results, and a representative experiment is presented. C: time course of MAP kinase inhibition. Stable clonal Neo (control) (lanes 15) and HA-Pnck protein-expressing (lanes 610) HEK-293 cells were serum starved and stimulated with 10 nM EGF for the indicated time periods. Lysates were immunoblotted with anti-phospho-MAP kinase PAb (WB: P-MAPK), anti-pan-ERK MAb (WB: MAPK), or with anti-HA MAb (WB: HA). Phospho-MAPK band densities were normalized to MAPK and are presented relative to nonstimulated Neo-HEK-293 cells (lane 1).
Fig. 2.
Fig. 2.
Ligand-independent EGFR downregulation by Pnck and dissection of MAP kinase signaling in Pnck-expressing HEK-293 cells. A: EGFR undergoes ligand-independent downregulation in HA-Pnck-expressing stable HEK-293 cells. Three dishes each of Neo and HA-Pnck HEK-293 cells [clone 4 (Cl-4)] were grown in complete medium overnight and then serum starved for 24 h in DMEM containing 10 mM HEPES, pH 7.4. Cells were left either without treatment (lanes 1 and 4) or were stimulated with 10 nM EGF for 3 min (E, lanes 2 and 5) or with 20% FBS (F, lanes 3 and 6) for 10 min. Lysates were immunoblotted for EGFR, GrbB2, Sos, Ras, Raf-1, MEK-1, MAPK, phospho-MAP kinase, HA-Pnck-, and β-actin. EGFR band density was normalized to β-actin and is presented relative to nonstimulated Neo-HEK-293 cells (lane 1). The experiment was repeated three times, and a representative experiment is presented. B: clonal HA-Pnck expression is approximately inversely proportional to EGFR expression. Stable Neo (Cl-4, lane 7) and HA-Pnck HEK-293 clones (Cl-4, lane 8; Cl-1, lane 9; and Cl-6, lane 10) were grown in complete medium and lysed. Equal amounts of total proteins were probed for EGFR (WB: EGFR), HA-Pnck (WB: HA), and β-actin (WB: β-actin) by Western blotting. EGFR band densities were normalized to β-actin and are presented relative to EGFR in Neo-HEK-293 Cl-4 (lane 7).
Fig. 3.
Fig. 3.
Inhibition of total tyrosine, EGFR, and Shc tyrosine phosphorylation by Pnck. A: inhibition of EGF-induced tyrosine phosphorylation in HA-Pnck expressing HEK-293 cells (lanes 16). Neo (lanes 13) and HA-Pnck HEK-293 (lanes 46) lysates were immunoblotted with anti-phosphotyrosine MAb (clone 4G-10). EGF-induced tyrosine-phosphorylated proteins at ∼180 kDa, 120 kDa, and 52 kDa that were strongly inhibited in HA-Pnck HEK-293 cells (lanes 2 and 5) are marked with arrowheads. Longer exposure (long exp) of ErbB portion of the blot is presented at bottom. B and C: inhibition of EGF-and FBS-induced Shc tyrosine phosphorylation in HA-Pnck HEK-293 cells. Two dishes of confluent Neo (lanes 7 and 8) and HA-Pnck HEK-293 (lanes 9 and 10) cells were serum starved overnight and stimulated without 10 nM EGF (lanes 7 and 9) or with 10 nM EGF (lanes 8 and 10) for 3 min at room temperature. Equal amounts of total lysates were immunoblotted with anti-phospho-Shc (Tyr239/240) PAb (WB: P-Shc Y239/240), or anti-phospho-Shc (Tyr317) PAb (WB: P-Shc Y317). EGF-induced tyrosine phosphorylation was observed only with the p52 Shc isoform, but not with p66Shc and p46Shc isoforms (data not shown). C: in this experiment, serum-starved, confluent Neo and HA-Pnck HEK-293 cells were stimulated without 20% FBS (lanes 11 and 13) or with 20% FBS (lanes 12 and 14) for 10 min at 37°C. Lysates were immunoblotted for Shc tyrosine phosphorylation (WB: P-Shc Y239/240 and WB: P-Shc Y317) as previously described. FBS-induced tyrosine phosphorylation was observed only in p66 Shc isoform but not in p52Shc and p46Shc isoforms (data not shown). The experiment was repeated three times with essentially identical results. D: inhibition of EGF induced EGFR Y845 phosphorylation by Pnck. Two dishes each of Neo and HA-Pnck HEK-293 (stable clone 4) were serum starved overnight and stimulated with EGF (lanes 16 and 18) or without EGF (lanes 15 and 17). Equal amounts of lysates were probed for EGFR (WB: EGFR), P-845Y EGFR (WB: P-845Y EGFR), phospho-MAPK (WB: PMAPK), MAPK (WB: MAPK), HA-Pnck (WB: HA-Pnck) and β-actin (WB: β-actin). EGFR band densities were normalized to β-actin and are presented relative to EGFR in nonstimulated Neo-HEK-293 cells (lane 15).
Fig. 4.
Fig. 4.
Immunokinase assay. Lysates of HEK-293 stable Neo (lanes 1 and 3) and HA-Pnck clones (lanes 2 and 4) were immunoprecipitated (IP) with control antibodies (lanes 1 and 2) or anti-HA monoclonal antibodies (lanes 3 and 4). Immunoprecipitates were subjected to immunokinase assay as described in experimental procedures, resolved by SDS-PAGE, transferred to PVDF membrane, and autoradiographed. The phosphorylated HA-Pnck band is indicated by an arrowhead. EGFR band densities (lysate input) are presented relative to that in Neo cells in each set of immunoprecipitations. EGFR band densities were normalized to β-actin and are presented relative to EGFR in Neo-HEK-293 cells in each set of immunoprecipitations (lanes 1 and 3, respectively). The experiment was repeated twice with identical results.
Fig. 5.
Fig. 5.
Ligand-independent EGFR downregulation by Pnck occurs by protea-lysosomal degradation, independent of EGFR tyrosine kinase activity. A: ligand-independent EGFR downregulation does not occur by transcriptional downregulation of the EGFR gene. Two sets of dishes, each containing a pair of either stable Neo- and HA-Pnck-expressing HEK-293 cells, plated at low density (25 × 103 cells/cm2) or high density (100 × 103 cells/cm2), were allowed to grow for 48 h in complete medium (DMEM containing 10% heat-inactivated FBS). Another two identical sets of dishes were allowed to grow for 24 h in complete medium and were then switched to serum-free medium (DMEM containing 10 mM HEPES, pH 7.4) for another 24 h. Total RNA was extracted from each dish, and relative levels of endogenous EGFR and Pnck (endogenous plus HA-Pnck) transcripts were determined by quantitative real-time RT-PCR. Values are means ± SD of RNA levels in each sample. A representative experiment of two experiments in which each point was assayed in triplicate is presented here. EGFR mRNA levels were not statistically significantly different as determined by two-tailed paired Student's t-test (P > 0.05). B: ligand-independent EGFR downregulation occurs by protea-lysosomal degradation of EGFR protein. Neo and HA-Pnck HEK-293 stable cells were incubated in serum with DMSO (lanes 1 and 2), ethanol (lanes 3 and 4), DMSO+ethanol (lanes 5 and 6), 10 μM MG-132 (MG; lanes 7 and 8), 300 nM bafilomycin A1 (Baf.A1; lanes 9 and 10), or a combination of 10 μM MG-132 and 300 nM bafilomycin A1 (lanes 11 and 12) for 6 h. After 6 h, lysates were prepared from the cells, normalized for total protein concentration, resolved by SDS-PAGE, and transferred to PVDF membranes. Membranes were probed for EGFR (WB: EGFR), HA-Pnck (WB: HA), and β-actin (WB: β-actin). EGFR band densities were normalized to β-actin and are presented relative to levels in Neo cells in each treatment group. A representative example of three experiments is presented. C: lysosomal degradation of EGFR in an EGF-induced manner. HEK-293 Neo cells were serum starved either without any drug treatment (lanes 13 and 14) or in the presence of 10 μM MG-132 (lane 15) or 300 nM bafilomycin A1 (lane 16) for 3 h. Cells were stimulated without 10 nM EGF (lane 13) or with 10 nM EGF (lanes 1416) for another 2 h in the same serum-free medium with or without the indicated drugs. Lysates were immunoblotted for EGFR (WB: EGFR) and β-actin (WB: β-actin). EGFR band densities were normalized to β-actin and are presented relative to EGFR in non-EGF-stimulated, non-drug-pretreated Neo-HEK-293 cells (lane 13). D and E: EGF-independent EGFR degradation by Pnck is EGFR tyrosine kinase independent. D: two pairs of dishes, each containing HEK-293 Neo (lanes 17 and 19) or HA-Pnck (lanes 18 and 20) stable cells were incubated in the presence of either DMSO (lanes 17 and 18) or 1 μM AG-1478 (lanes 19 and 20) in serum for 1 h. Cells were lysed, and the lysates were immunoblotted for EGFR (WB: EGFR), HA-Pnck (WB: HA), and β-actin (WB: β-actin). EGFR band densities were normalized to β-actin and are presented relative to EGFR in DMSO-pretreated Neo-HEK-293 cells (lane 17). E: this experiment is identical to that presented in D except that each set of HEK-293 Neo and HA-Pnck stable cells was incubated in the presence of either DMSO (lanes 21 and 22) or 1 μM AG-1478 (lanes 23 and 24) in serum-free medium for 1 h. Cells were lysed, and the lysates were immunoblotted for EGFR (WB: EGFR), HA-Pnck (WB: HA), and β-actin (WB: β-actin). EGFR band densities were normalized to β-actin and are presented relative to EGFR in DMSO-pretreated Neo-HEK-293 cells (lane 21). The experiments in D and E were repeated four times with consistent results, and a representative example is presented. F: EGF-dependent EGFR degradation requires EGFR tyrosine kinase activity. HEK-293 Neo stable cells were serum starved overnight and were either left untreated (lanes 2527) or were treated with 1 μM AG-1478 (lanes 28 and 29) for 1 h. Following drug treatment, plates were either left unstimulated (lane 25) or were treated with 10 nM EGF for either 5 min (lanes 26 and 28) or 2 h (lanes 27 and 29). Cells lysates were immunoblotted for EGFR (WB: EGFR), phospho-EGFR (Y845) (WB: EGFR P-Y845), phospho-MAPK (WB: P-MAPK), MAPK (WB: MAPK), and β-actin (WB: β-actin). EGFR band densities were normalized to β-actin and are expressed relative to levels EGFR in non-EGF-stimulated, non-drug-pretreated Neo-HEK-293 cells (lane 25).
Fig. 6.
Fig. 6.
Upregulation of unliganded EGFR by small interfering (si)RNA-mediated knockdown of endogenous human Pnck in SK-BR-3 cells. A: upregulation of endogenous EGFR by Pnck siRNA. Subconfluent SK-BR-3 breast cancer cells were transfected with either control siRNA (luciferase) (lanes 1 and 2) or with siRNA directed against human Pnck (lanes 3 and 4). Cells were allowed to grow for the next 48 h following transfection and were then serum starved for another 24 h. Cells were stimulated with or without 10 nM EGF for 5 min and lysed. The lysates were normalized for total protein, and equal amounts of total protein were resolved by SDS-PAGE, transferred to PVDF membrane, and immunoblotted for EGFR (WB: EGFR), and β-actin (WB: β-actin). EGFR band densities were normalized to β-actin and are presented relative to EGFR in non-EGF-stimulated, control siRNA-transfected cells (lane 1). B: real-time quantitative RT-PCR for endogenous EGFR and Pnck in SK-BR-3 cells. Total RNA was extracted from an identical set of plates (described in A), and the relative levels of endogenous EGFR and endogenous Pnck were determined by quantitative RT-PCR. Samples were analyzed from each RNA sample, and values are means ± SD [in arbitrary units (AU)] of each sample. A representative example of two experiments conducted in triplicate is presented here. Statistical analysis was by the two-tailed paired Student's t-test as described in results. C: SK-BR-3 cells were transfected with either control siRNA (lanes 57) or Pnck siRNA (lanes 810) as described in A. Cells were serum starved and left nonstimulated (lanes 5 and 8) or were stimulated with either 10 nM EGF for 5 min (lanes 6 and 9) or 20% FBS for 10 min (lanes 7 and 10). Equal amounts of lysates were immunoblotted for EGFR (WB: EGFR), endogenous Pnck (WB: Pnck), or β-actin (WB: β-actin). EGFR band density was normalized to β-actin and is presented relative to EGFR in control siRNA-transfected nonstimulated cells (lane 5).

Similar articles

Cited by

References

    1. Alwan HA, van Zoelen EJ, van Leeuwen JE. Ligand-induced lysosomal epidermal growth factor receptor (EGFR) degradation is preceded by proteasome-dependent EGFR de-ubiquitination. J Biol Chem 278: 35781–35790, 2003. - PubMed
    1. Baselga J, Mendelsohn J. The epidermal growth factor receptor as a target for therapy in breast carcinoma. Breast Cancer Res Treat 29: 127–138, 1994. - PubMed
    1. Bowtell DD, Langdon WY. The protein product of the c-cbl oncogene rapidly complexes with the EGF receptor and is tyrosine phosphorylated following EGF stimulation. Oncogene 11: 1561–1567, 1995. - PubMed
    1. Callus BA, Mathey-Prevot B. SOCS36E, a novel Drosophila SOCS protein, suppresses JAK/STAT and EGF-R signalling in the imaginal wing disc. Oncogene 21: 4812–4821, 2002. - PubMed
    1. Carlin CR, Tollefson AE, Brady HA, Hoffman BL, Wold WS. Epidermal growth factor receptor is down-regulated by a 10,400 MW protein encoded by the E3 region of adenovirus. Cell 57: 135–144, 1989. - PubMed

Publication types

MeSH terms

Substances