

Optical imaging of cell mass and growth dynamics
- PMID: 18562484
- PMCID: PMC2518415
- DOI: 10.1152/ajpcell.00121.2008
Optical imaging of cell mass and growth dynamics
Abstract
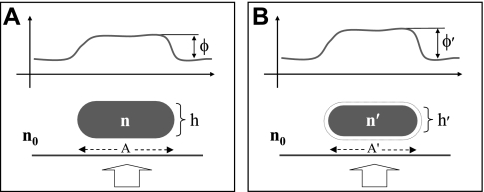
Using novel interferometric quantitative phase microscopy methods, we demonstrate that the surface integral of the optical phase associated with live cells is invariant to cell water content. Thus, we provide an entirely noninvasive method to measure the nonaqueous content or "dry mass" of living cells. Given the extremely high stability of the interferometric microscope and the femtogram sensitivity of the method to changes in cellular dry mass, this new technique is not only ideal for quantifying cell growth but also reveals spatially resolved cellular and subcellular dynamics of living cells over many decades in a temporal scale. Specifically, we present quantitative histograms of individual cell mass characterizing the hypertrophic effect of high glucose in a mesangial cell model. In addition, we show that in an epithelial cell model observed for long periods of time, the mean squared displacement data reveal specific information about cellular and subcellular dynamics at various characteristic length and time scales. Overall, this study shows that interferometeric quantitative phase microscopy represents a noninvasive optical assay for monitoring cell growth, characterizing cellular motility, and investigating the subcellular motions of living cells.
Figures


Similar articles
-
Quantitative phase imaging of live cells using fast Fourier phase microscopy.Appl Opt. 2007 Apr 1;46(10):1836-42. doi: 10.1364/ao.46.001836. Appl Opt. 2007. PMID: 17356628
-
Fourier phase microscopy for investigation of biological structures and dynamics.Opt Lett. 2004 Nov 1;29(21):2503-5. doi: 10.1364/ol.29.002503. Opt Lett. 2004. PMID: 15584275
-
Sample and substrate preparation for exploring living neurons in culture with quantitative-phase imaging.Methods. 2018 Mar 1;136:90-107. doi: 10.1016/j.ymeth.2018.02.001. Epub 2018 Feb 10. Methods. 2018. PMID: 29438830 Review.
-
Effect of supercooling and cell volume on intracellular ice formation.Cryobiology. 2015 Apr;70(2):156-63. doi: 10.1016/j.cryobiol.2015.02.002. Epub 2015 Feb 21. Cryobiology. 2015. PMID: 25707695
-
Effect of volume expansion with hypertonic- and isotonic saline and isotonic glucose on sodium and water transport in the principal cells in the kidney.BMC Nephrol. 2013 Sep 26;14:202. doi: 10.1186/1471-2369-14-202. BMC Nephrol. 2013. PMID: 24067081 Free PMC article. Clinical Trial.
Cited by
-
Three-Dimensional Shapes and Cell Deformability of Rat Red Blood Cells during and after Asphyxial Cardiac Arrest.Emerg Med Int. 2019 Oct 15;2019:6027236. doi: 10.1155/2019/6027236. eCollection 2019. Emerg Med Int. 2019. PMID: 31737367 Free PMC article.
-
The Enhancement of Antimicrobial Photodynamic Therapy of Escherichia Coli by a Functionalized Combination of Photosensitizers: In Vitro Examination of Single Cells by Quantitative Phase Imaging.Int J Mol Sci. 2022 May 30;23(11):6137. doi: 10.3390/ijms23116137. Int J Mol Sci. 2022. PMID: 35682814 Free PMC article.
-
Neurons: The Interplay between Cytoskeleton, Ion Channels/Transporters and Mitochondria.Cells. 2022 Aug 11;11(16):2499. doi: 10.3390/cells11162499. Cells. 2022. PMID: 36010576 Free PMC article. Review.
-
Three-dimensional label-free observation of individual bacteria upon antibiotic treatment using optical diffraction tomography.Biomed Opt Express. 2020 Feb 3;11(3):1257-1267. doi: 10.1364/BOE.377740. eCollection 2020 Mar 1. Biomed Opt Express. 2020. PMID: 32206407 Free PMC article.
-
Quantitative phase imaging of stromal prognostic markers in pancreatic ductal adenocarcinoma.Biomed Opt Express. 2020 Feb 12;11(3):1354-1364. doi: 10.1364/BOE.383242. eCollection 2020 Mar 1. Biomed Opt Express. 2020. PMID: 32206415 Free PMC article.
References
-
- Akkin T, Dave DP, Milner TE, Rylander HG. Detection of neural activity using phase-sensitive optical low-coherence reflectometry. Opt Express 12: 2377–2386, 2004. - PubMed
-
- Allman BE, McMahon PJ, Tiller JB, Nugent KA, Paganin D, Barty A, McNulty I, Frigo SP, Wang YX, Retsch CC. Noninterferometric quantitative phase imaging with soft x rays. J Opt Soc Am A 17: 1732–1743, 2000. - PubMed
-
- Amin MS, Park Y, Lue N, Dasari RR, Badizadegan K, Feld MS, Popescu G. Microrheology of red blood cell membranes using dynamic scattering microscopy. Opt Express 15: 17001–17009, 2007. - PubMed
-
- Baber R Interference microscopy and mass determination. Nature 169: 366–367, 1952. - PubMed
-
- Bajt S, Barty A, Nugent KA, McCartney M, Wall M, Paganin D. Quantitative phase-sensitive imaging in a transmission electron microscope. Ultramicroscopy 83: 67–73, 2000. - PubMed
Publication types
MeSH terms
Substances
Grants and funding
LinkOut - more resources
Full Text Sources
Other Literature Sources