. 2008 Sep;82(17):8743-61.
doi: 10.1128/JVI.00584-08. Epub 2008 Jun 18.

Conserved footprints of APOBEC3G on Hypermutated human immunodeficiency virus type 1 and human endogenous retrovirus HERV-K(HML2) sequences

Affiliations

Conserved footprints of APOBEC3G on Hypermutated human immunodeficiency virus type 1 and human endogenous retrovirus HERV-K(HML2) sequences

Andrew E Armitage et al. J Virol. 2008 Sep.

Abstract

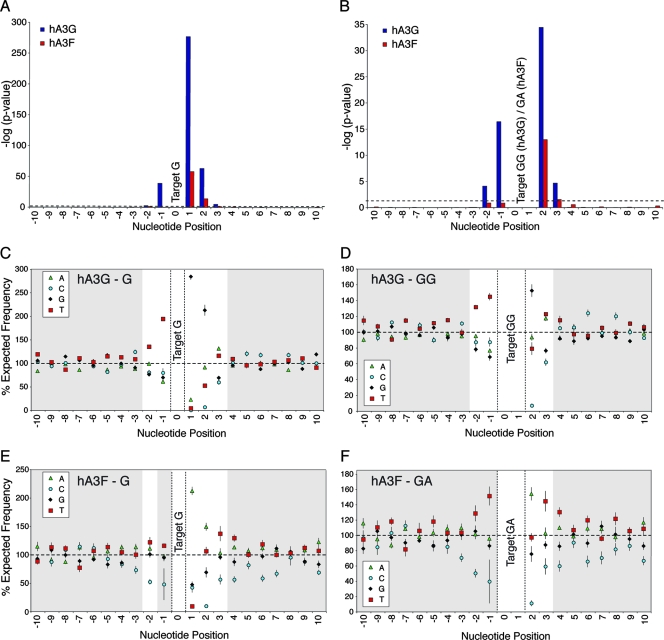
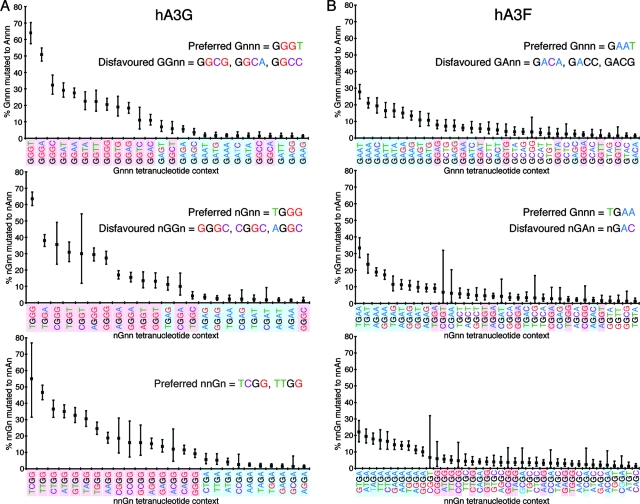
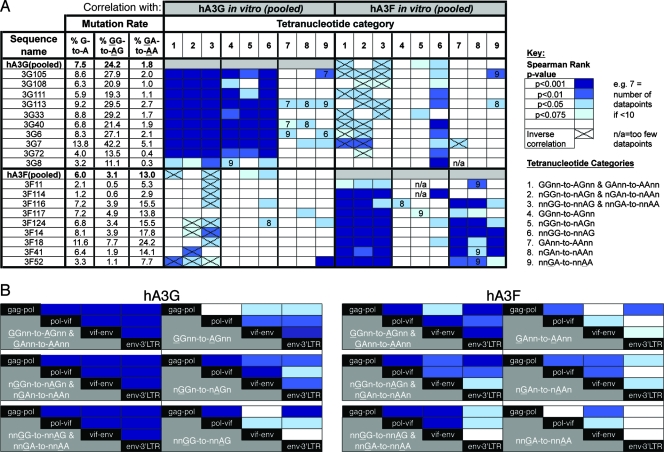
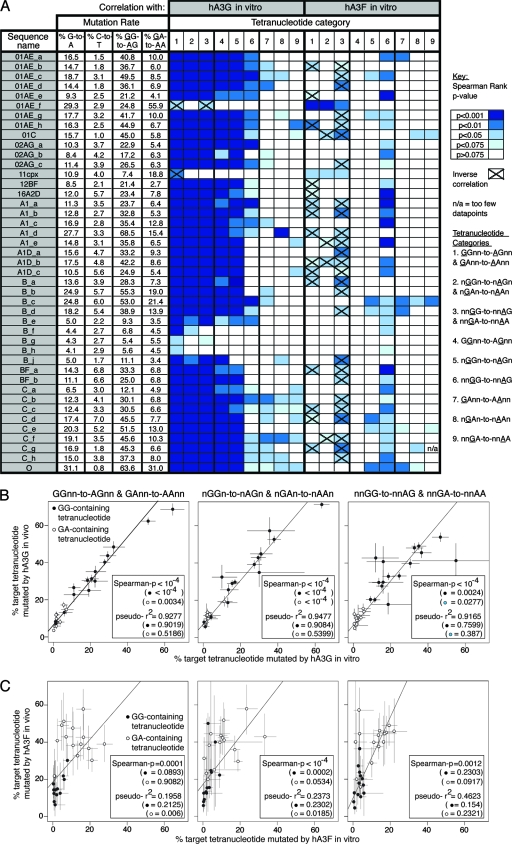
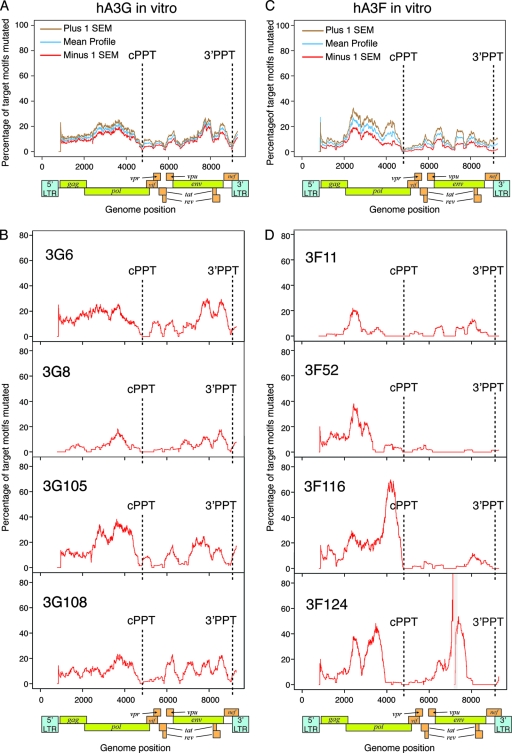
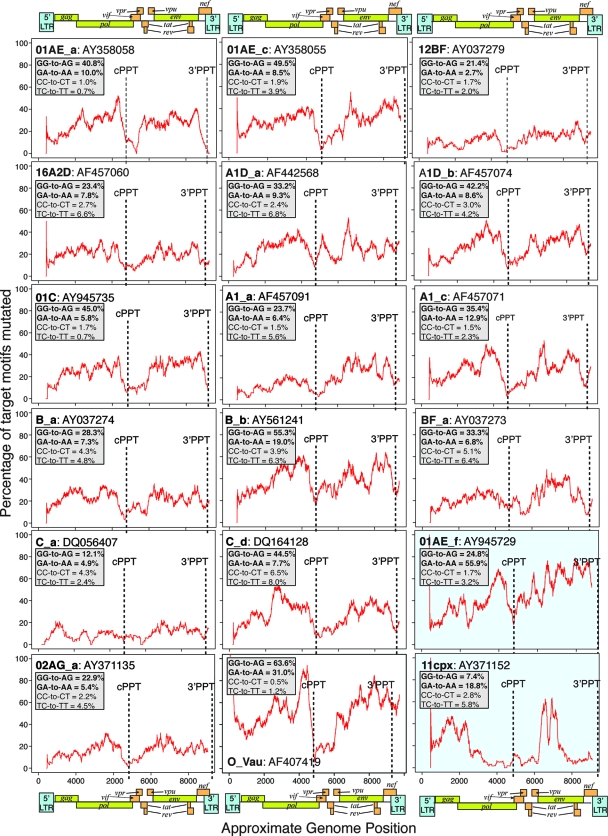
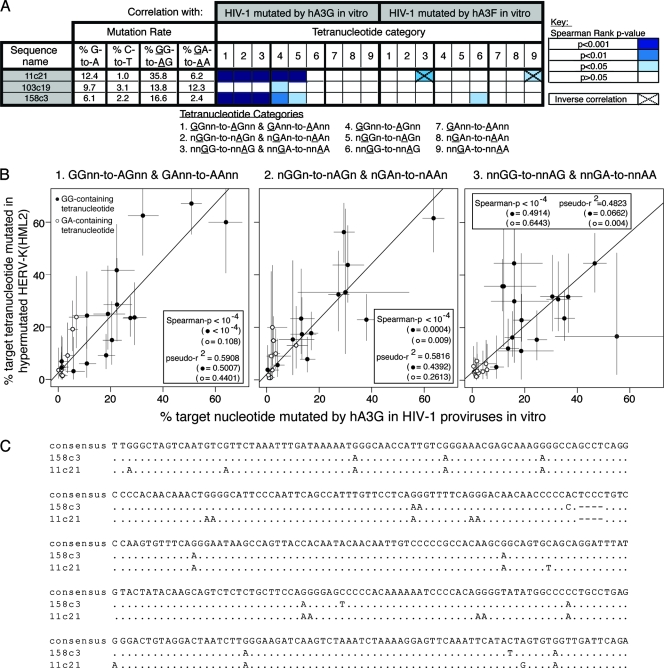
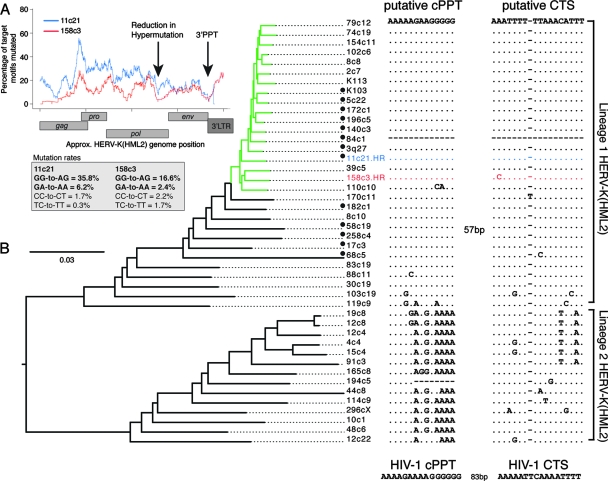
The human polynucleotide cytidine deaminases APOBEC3G (hA3G) and APOBEC3F (hA3F) are antiviral restriction factors capable of inducing extensive plus-strand guanine-to-adenine (G-to-A) hypermutation in a variety of retroviruses and retroelements, including human immunodeficiency virus type 1 (HIV-1). They differ in target specificity, favoring plus-strand 5'GG and 5'GA dinucleotide motifs, respectively. To characterize their mutational preferences in detail, we analyzed single-copy, near-full-length HIV-1 proviruses which had been hypermutated in vitro by hA3G or hA3F. hA3-induced G-to-A mutation rates were significantly influenced by the wider sequence context of the target G. Moreover, hA3G, and to a lesser extent hA3F, displayed clear tetranucleotide preference hierarchies, irrespective of the genomic region examined and overall hypermutation rate. We similarly analyzed patient-derived hypermutated HIV-1 genomes using a new method for estimating reference sequences. The majority of these, regardless of subtype, carried signatures of hypermutation that strongly correlated with those induced in vitro by hA3G. Analysis of genome-wide hA3-induced mutational profiles confirmed that hypermutation levels were reduced downstream of the polypurine tracts. Additionally, while hA3G mutations were found throughout the genome, hA3F often intensely mutated shorter regions, the locations of which varied between proviruses. We extended our analysis to human endogenous retroviruses (HERVs) from the HERV-K(HML2) family, finding two elements that carried clear footprints of hA3G activity. This constitutes the most direct evidence to date for hA3G activity in the context of natural HERV infections, demonstrating the involvement of this restriction factor in defense against retroviral attacks over millions of years of human evolution.


Figures

FIG. 1.
FIG. 1.
The influence of surrounding nucleotides on hA3G- and hA3F-induced G-to-A mutation rates in HIV-1 proviruses in vitro. (A and B) To analyze the influence of the surrounding nucleotides on G-to-A mutation rates, a series of chi-square analyses (with three degrees of freedom) examining the independence of mutation rates on the nucleotide at each consecutive position from 100 nucleotides downstream to 100 nucleotides upstream of the target plus-strand G (panel A), GG, or GA (panel B) motif were carried out (i.e., N(−99X)G, N(−98X)G… G(+98X)N, G(+99X)N; or N(−99X)GG… GG(+98X)N, where the target G = position 0). Only nucleotides spanning positions −10 to +10 are shown here for clarity; no significant deviations from independence were observed outside of this region in any data set. Each individual sequence mutated by hA3G or hA3F was analyzed independently; P values for each nucleotide position from each sequence were then combined using Fisher's method for combining independent tests to assess the influence of each nucleotide position for the hA3G (blue bars) and hA3F (red bars) data sets, respectively. Data represent the negative log10 of the P value; the dashed line indicates the value corresponding to P < 0.05. (C to F) The frequency of each nucleotide, relative to its expected frequency, at each position with respect to target G (C [hA3G] and E [hA3F]), target GG (D, hA3G) or target GA (F, hA3F) motifs. Data points represent the mean percentages of the expected nucleotide frequency; error bars depict the standard errors of the means; significant data are highlighted with a white background.
FIG. 2.
FIG. 2.
Nucleotide context preferences of G-to-A mutations induced in HIV-1 proviruses by hA3G and hA3F in vitro. The tetranucleotide mutational preferences in proviral sequences, spanning gag-3′LTR, isolated from 293T cells infected with VSV-G-pseudotyped vif-deficient HIV-1IIIB generated in the presence of hA3G (A) or hA3F (B), were analyzed relative to their known parental sequence. The proportion of each type of available G-containing tetranucleotide context carrying G-to-A mutations (Gnnn-to-Annn, nGnn-to-nAnn, and nnGn-to-nnAn, respectively) was determined; these overlapping tetranucleotides covered the region spanning positions −2 to +3 relative to the target G (position 0). Data from the hA3G (10 sequences, 83.7kb) and hA3F (9 sequences, 68.8kb) sequence sets were pooled. Only tetranucleotide contexts with mutation rates greater than 1% are shown; tetranucleotides highlighted in pink and blue contain the hA3G 5′GG and hA3F 5′GA preferred dinucleotides, respectively; the target G nucleotide is black; the surrounding nucleotides are colored differently for clarity; error bars represent 95% confidence intervals based on a binomial distribution.
FIG. 3.
FIG. 3.
Conservation of tetranucleotide preference hierarchies in individual hypermutated proviruses and subgenomic fragments. (A) Correlation between the tetranucleotide preference hierarchies observed in the pooled hA3G and hA3F data sets and in each individual provirus comprising the pooled data sets. Spearman rank correlations between the arrays of mutation rates observed in individual sequences and the pooled data sets were determined, considering mutation within different categories of tetranucleotide contexts; darker shades of blue indicate more highly significant correlations; contexts with zero mutation rates were excluded, since a large number of tied ranks can compromise the Spearman's rank test. For each individual provirus, G-to-A, GG-to-AG, and GA-to-AA mutation rates are indicated. Weighted Poisson regression analyses were also carried out, yielding similar results (data not shown). (B) Correlation of tetranucleotide mutational preferences observed in different subgenomic regions of HIV-1 sequences by hA3G and hA3F in vitro. Near-full-length proviruses mutated by hA3G or hA3F were divided arbitrarily into four 2.1-kb fragments (spanning gag-pol (HXB2 1200-3325), pol-vif (HXB2 3326-5450), vif-env (HXB2 5451-7575), and env-3LTR (HXB2 7576-9680); four additional non-full-length (env-3′LTR) sequences from the hA3G experiment and six additional non-full-length (env-3LTR) sequences for the hA3F experiment, derived from the same infections, were added to this analysis. The correlation between the tetranucleotide substrate preferences in each fragment with that in each other fragment, for the categories of tetranucleotide context shown, was assessed using Spearman rank correlations, color coded as described above. Weighted Poisson regression analyses were also carried out, yielding similar results (data not shown). Contexts with zero mutation rates were excluded.
FIG. 4.
FIG. 4.
Correlation of tetranucleotide mutational preferences observed in hypermutated HIV-1 sequences in vivo with those observed in proviruses hypermutated by hA3G or hA3F in vitro. (A) The tetranucleotide preferences hierarchies in 43 near-full-length HIV-1 sequences marked as hypermutated in the Los Alamos HIV sequence database were determined using reference sequences estimated as described. Each sequence was assigned a name according to its subtype. Spearman rank correlations between the arrays of mutation rates observed in each individual in vivo sequence and those in the pooled data sets for proviruses hypermutated in vitro by hA3G or hA3F were determined, considering mutation within different categories of tetranucleotide contexts; darker shades of blue indicate more significant correlations. Contexts with zero mutation rates were excluded since a large number of tied ranks can compromise the Spearman's rank test; pairs of data for which a significant inverse correlation was found are indicated. For each individual provirus, G-to-A, GG-to-AG, and GA-to-AA mutation rates are indicated; C-to-T mutation rates are shown to give an indication of the noise associated with each analysis. Weighted Poisson regression analyses were also carried out, yielding similar results (data not shown). (B) The tetranucleotide preference data (with the target guanine at either position 1, 2, or 3 of the tetranucleotide) from the 38 in vivo proviruses carrying strong evidence of hA3G activity were pooled and correlated with the pooled tetranucleotide mutational preferences for proviruses hypermutated by hA3G in vitro. Each point represents a particular tetranucleotide context; GG- and GA-containing tetranucleotide contexts are represented by black filled and unfilled circles, respectively. Spearman rank correlation P values are indicated and take into consideration both the GG- and GA-containing contexts together, with the P values determined when only GG- or GA-containing tetranucleotide contexts were considered (shown in parentheses); similarly, the McFadden Pseudo-R2 statistic, a measure of the goodness of fit of the regression which accounts for the availability of each target context, is indicated. Contexts with zero mutation rates were excluded. Error bars correspond to binomial 95% confidence intervals. (C) As for panel B, the tetranucleotide preference data (with the target guanine either at position 1, 2, or 3 of the tetranucleotide) from the two in vivo proviruses potentially mutated by hA3F were pooled and correlated with the pooled tetranucleotide mutational preferences for proviruses hypermutated by hA3F in vitro.
FIG. 5.
FIG. 5.
Genome-wide hypermutation profiles induced in vitro by hA3G and hA3F. Genome-wide hypermutation profiles were generated by calculating the proportion of GG and GA dinucleotide targets mutated to AG and AA, respectively, in 400-bp sliding windows to the 3′ of the base under consideration, advancing in 1-bp steps across the genome. Consequently, the influence of a particular position on the profile commences 400 bp upstream of the position on the plot, and aberrant effects on the profiles may be observed within 400 bp of the ends of the sequences or gaps. The exact locations of the cPPT and 3′PPT in each sequence are indicated. (A) Mean profile (blue line) for proviruses hypermutated by hA3G in vitro (representative of 10 near-full-length proviruses); brown and red lines represent plus and minus 1 standard error of the mean. For each sequence, data for positions where less than 100 bases of actual sequence data were present in the 400-bp window (such as at the start of the sequence or around a gap) were omitted to avoid potential skewing of the mean profiles. (B) Representative profiles of hypermutation in four individual proviruses mutated by hA3G. The remaining profiles are shown in Fig. S4A of the supplemental material. (C) Mean profile (blue line) for proviruses hypermutated by hA3F in vitro (representative of nine near-full-length proviruses, six of which contained short gaps); brown and red lines represent plus and minus 1 standard error of the mean. For each sequence, data for positions where less than 100 bases of actual sequence data were present in the 400-bp window (such as at the start of the sequence or around a gap) were omitted to avoid potential skewing of the mean profiles. (D) Representative profiles of hypermutation in four individual proviruses mutated by hA3F. The positions of gaps in sequences are marked with gray boxes. The remaining profiles are shown in Fig. S4B of the supplemental material.
FIG. 6.
FIG. 6.
Representative profiles of hypermutation in proviruses derived from natural infections. Profiles of hypermutation across each near-full-length in vivo genome investigated were generated by calculating the proportion of target GG and GA dinucleotides mutated to AG and AA, respectively, in 400-bp sliding windows to the 3′ of the base under consideration, advancing in 1-bp steps across the genome. Consequently, the influence of a particular position on the profile commences 400 bp upstream of the position on the plot, and aberrant effects on the profiles may be observed within 400 bp of the end of the sequence. Sequence names according to subtype, as given in Table S2 of the supplemental material, are shown, together with the GenBank accession number of the sequence. The marked locations of the cPPT and 3′PPT indicated for each sequence are exact; these do not necessarily align with the approximate genome maps shown, as the lengths of the hypermutated sequences analyzed were variable. GG-to-AG and GA-to-AA mutation rates are indicated, together with the equivalent minus-strand mutations (plus-strand CC-to-CT and TC-to-TT) to give an indication of the noise associated with each analysis. The panels highlighted in blue indicate the proviruses carrying predominantly hA3F-type 5′GA-to-AA mutations; the remainder carried predominantly hA3G-type 5′GG-to-AG mutations. The remaining profiles are shown in Fig. S5 of the supplemental material.
FIG. 7.
FIG. 7.
Correlation of tetranucleotide mutational preferences in naturally occurring hypermutated HERV-K(HML2) sequences with those observed in proviruses hypermutated in vitro by hA3G or hA3F. (A) HERV-K(HML2) proviruses were screened for hypermutation as described elsewhere. The tetranucleotide mutational preference hierarchies in the HERV-K(HML2) elements carrying evidence of potential hA3 activity (11c21, 103c19, and 158c3) were determined using improved reference sequences estimated as described elsewhere. Spearman rank correlations between the arrays of mutation rates observed in each element and those in the pooled data sets for proviruses hypermutated in vitro by hA3G or hA3F were determined, considering mutation within different categories of tetranucleotide contexts. Darker shades of blue indicate more significant correlations; contexts with zero mutation rates were excluded, since a large number of tied ranks can compromise the Spearman's rank test. Pairs of data for which a significant inverse correlation was found are indicated. For each HERV-K(HML2) element, G-to-A, GG-to-AG, and GA-to-AA mutation rates are indicated; C-to-T mutation rates are shown to give an indication of the noise associated with each analysis. Weighted Poisson regression analyses were also carried out, yielding similar results (data not shown). (B) The tetranucleotide preference data (with the target G either at position 1, 2, or 3 of the tetranucleotide) from the two HERV-K(HML2) elements that showed strong evidence of hA3G activity (11c21 and 158c3) were pooled and correlated with the pooled tetranucleotide mutational preferences for proviruses hypermutated by hA3G in vitro. Each point represents a particular tetranucleotide context; GG- and GA-containing tetranucleotide contexts are represented by black-filled and unfilled circles, respectively. Spearman rank correlation P values are indicated and were generated considering both the GG- and GA-containing contexts together, with the P values determined when only GG- or GA-containing tetranucleotide contexts were considered shown in parentheses; similarly, the McFadden Pseudo-R2 statistic, a measure of the goodness of fit of the regression, is indicated. Contexts with zero mutation rates were excluded. Error bars correspond to binomial 95% confidence intervals. (C) Section of HERV-K(HML2) gag sequence from hypermutated elements 11c21 and 158c3.
FIG. 8.
FIG. 8.
Conservation of putative cPPT and CTS motifs in a group of HERV-K(HML2) elements. (A) Hypermutation profiles across the HERV-K(HML2) elements 11c21 (blue line) and 158c3 (red line) were generated by calculating the proportion of target GG and GA dinucleotides mutated to AG and AA, respectively, in 400-bp sliding windows to the 3′ of the base under consideration, advancing in 1-bp steps across the genome. Consequently, the influence of a particular position on the profile commences 400 bp upstream of the position on the plot, and aberrant effects on the profiles may be observed within 400 bp of the ends of the sequences. The position of a common reduction in hypermutational burden in the two sequences is indicated. GG-to-AG and GA-to-AA mutation rates are indicated, together with the equivalent minus-strand mutations (plus-strand CC-to-CT and TC-to-TT) to give an indication of the noise associated with each analysis. (B) Maximum likelihood tree generated from 44 near-full-length HERV-K elements; the hA3-type mutations within the hypermutated elements 11c21 (blue) and 158c3 (red), denoted HR, were repaired prior to construction of the tree. The human-specific subgroup of HERV-K(HML2) elements is indicated in green. An alignment of the putative cPPT and CTS regions for each HERV-K(HML2) element in the tree is shown, with the two major lineages designated lineage 1 and lineage 2. The two regions are separated by 57 bp. No sequence for this region is present in element 84c1. Type 1 HERV-K(HML2) sequences, characterized by a 292-bp deletion at the pol-env boundary, are indicated with a black circle; all others are type 2 sequences. The HIV-1 cPPT and CTS sequences are shown for comparison.

References

    1. Beale, R. C., S. K. Petersen-Mahrt, I. N. Watt, R. S. Harris, C. Rada, and M. S. Neuberger. 2004. Comparison of the differential context-dependence of DNA deamination by APOBEC enzymes: correlation with mutation spectra in vivo. J. Mol. Biol. 337585-596. - PubMed
    1. Belshaw, R., A. L. Dawson, J. Woolven-Allen, J. Redding, A. Burt, and M. Tristem. 2005. Genomewide screening reveals high levels of insertional polymorphism in the human endogenous retrovirus family HERV-K(HML2): implications for present-day activity. J. Virol. 7912507-12514. - PMC - PubMed
    1. Belshaw, R., V. Pereira, A. Katzourakis, G. Talbot, J. Paces, A. Burt, and M. Tristem. 2004. Long-term reinfection of the human genome by endogenous retroviruses. Proc. Natl. Acad. Sci. USA 1014894-4899. - PMC - PubMed
    1. Bhattacharya, T., M. Daniels, D. Heckerman, B. Foley, N. Frahm, C. Kadie, J. Carlson, K. Yusim, B. McMahon, B. Gaschen, S. Mallal, J. I. Mullins, D. C. Nickle, J. Herbeck, C. Rousseau, G. H. Learn, T. Miura, C. Brander, B. Walker, and B. Korber. 2007. Founder effects in the assessment of HIV polymorphisms and HLA allele associations. Science 3151583-1586. - PubMed
    1. Bishop, K. N., R. K. Holmes, and M. H. Malim. 2006. Antiviral potency of APOBEC proteins does not correlate with cytidine deamination. J. Virol. 808450-8458. - PMC - PubMed

Publication types

LinkOut - more resources