. 2008 Sep;82(17):8780-96.
doi: 10.1128/JVI.00630-08. Epub 2008 Jun 18.

Nonstructural proteins 1 and 2 of respiratory syncytial virus suppress maturation of human dendritic cells

Affiliations

Nonstructural proteins 1 and 2 of respiratory syncytial virus suppress maturation of human dendritic cells

Shirin Munir et al. J Virol. 2008 Sep.

Abstract

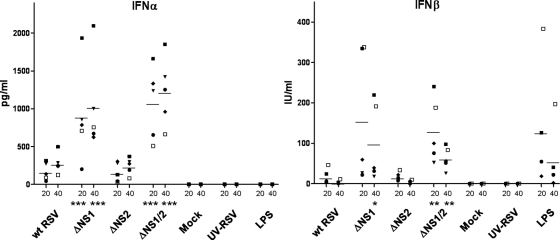
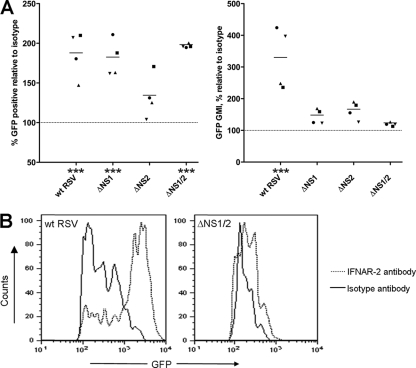
Human respiratory syncytial virus (RSV) is the most important agent of serious pediatric respiratory tract disease worldwide. One of the main characteristics of RSV is that it readily reinfects and causes disease throughout life without the need for significant antigenic change. The virus encodes nonstructural protein 1 (NS1) and NS2, which are known to suppress type I interferon (IFN) production and signaling. In the present study, we monitored the maturation of human monocyte-derived myeloid dendritic cells (DC) following inoculation with recombinant RSVs bearing deletions of the NS1 and/or NS2 proteins and expressing enhanced green fluorescent protein. Deletion of the NS1 protein resulted in increased expression of cell surface markers of DC maturation and an increase in the expression of multiple cytokines and chemokines. This effect was enhanced somewhat by further deletion of the NS2 protein, although deletion of NS2 alone did not have a significant effect. The upregulation was largely inhibited by pretreatment with a blocking antibody against the type I IFN receptor, suggesting that suppression of DC maturation by NS1/2 is, at least in part, a result of IFN antagonism mediated by these proteins. Therefore, this study identified another effect of the NS1 and NS2 proteins. The observed suppression of DC maturation may result in decreased antigen presentation and T-lymphocyte activation, leading to incomplete and/or weak immune responses that might contribute to RSV reinfection.


Figures

FIG. 1.
FIG. 1.
Insertion of a transcription cassette expressing enhanced GFP between the P and M genes of recombinant wt RSV and NS1/NS2 gene deletion RSVs. The diagram shows (from left to right) the end of the P gene, followed by an intergenic region, followed by the inserted GFP transcription cassette, in which the GFP ORF was engineered to be flanked with a copy of the gene start (GS) transcription signal from the RSV N gene and a copy of the gene end (GE) signal from the RSV G gene, followed by an intergenic region, followed by the start of the M gene. The sequence is positive sense, translation initiation and termination codons are in bold, and the ClaI and SalI restriction endonuclease sites used in the construction are italicized. In the original biological RSV strain A2 isolate on which the recombinant system is based, the intergenic region between the P and M genes has the sequence GGAAAGGGT. All of the viruses used in subsequent experiments were these GFP-expressing recombinants.
FIG. 2.
FIG. 2.
Concentration of IFN-α (in pg/ml) and IFN-β (in IU/ml) in the medium of DC 20 and 40 h after inoculation with the indicated viruses at an input MOI of 2, or mock treatment, inoculation with an equivalent amount of wt RSV that had been inactivated with UV irradiation, or treatment with 1 μg/ml LPS. Immature DC from five donors were analyzed in separate experiments; the mean values are indicated by horizontal bars. Statistically significant differences compared to wt RSV are indicated: *, P < 0.05; **, P < 0.01; ***, P < 0.001. The various symbols represent individual donors, with the same symbol used in the two panels.
FIG. 3.
FIG. 3.
Infectivity of wt RSV and the NS1/NS2 gene deletion mutants for immature DC, MOI of 2. A. Photomicrographs of DC from a single donor 40 h after infection with the indicated viruses at an input MOI of 2, or mock treated. First row, fluorescence microscopy captured at 200× magnification; second and third rows, bright-field microscopy, captured at 200× and 500×, respectively. Small green dots seen in the wt RSV-infected DC preparation likely represent autofluorescence of GFP-negative cells due to the high brightness of fluorescence of the GFP-positive cells (larger round spheres). DC infected with the UV-inactivated wt RSV looked essentially like the mock-infected cells and are not shown. B. Representative primary flow cytometry analysis of DC from a single donor 40 h after inoculation with the indicated viruses. C and D. Summary of flow cytometry analysis of DC from six donors (panel C) or five donors (panel D) 40 h after inoculation with the indicated viruses, with mean values indicated by horizontal bars. (C) Percentage of GFP-positive cells; (D) GMI of GFP fluorescence in the GFP-positive populations from panel C. Statistically significant differences compared to wt RSV are indicated: *, P < 0.05; ***, P < 0.001. Individual donors are indicated with different symbols, and same donors/symbols were used in panels C and D.
FIG. 4.
FIG. 4.
Cell surface expression of five maturation markers 40 h after inoculation of immature DC with the indicated viruses at an input MOI of 2, or an equivalent amount of UV-inactivated wt RSV, mock treatment, or treatment with 1 μg/ml LPS. A. Example of primary flow cytometry data for wt RSV and ΔNS1/2 in DC from one donor. B. GMI of expression of the five maturation markers in DC inoculated with the indicated viruses and controls, relative to wt RSV as 100%. Seven donors are represented by different symbols, with the same donors/symbols in each panel. Expression levels of CD80, CD83, and CD54 for LPS-treated DC were analyzed in the same experiments as the viruses; however, they are shown on a different scale, as GMI values were substantially higher for LPS than other treatments. Statistically significant differences compared to wt RSV are indicated: *, P < 0.05; **, P < 0.01; ***, P < 0.001.
FIG. 5.
FIG. 5.
Concentrations of selected cytokines (A) and chemokines (B) in the medium 20 and 40 h after inoculation of immature DC with the indicated viruses at an input MOI of 2 or an equivalent amount of UV-inactivated wt RSV, mock treatment, or treatment with 1 μg/ml LPS. Three donors are represented by different symbols, with the same donors/symbols used in each panel. The DC supernatants were analyzed in a Luminex bead assay except in the case of IP-10/CXCL10, which was determined by ELISA. Note that the IL-12/23 p40 subunit is shared with IL-23, a cytokine that enhances IFN-γ production but mainly in memory rather than naïve T cells.
FIG. 6.
FIG. 6.
Infectivity of wt RSV and the NS1/2 gene deletion mutants (input MOI of 2) in immature DC following treatment with the IFNAR2-blocking monoclonal antibody or an isotype control antibody, assayed by flow cytometry 40 h after virus inoculation. (A) Percent change in the number of GFP-expressing cells in the total population (left panel) and the GMI of GFP expression in the GFP-positive cells for IFNAR2-blocking antibody-treated DC from four donors, expressed relative to the isotype control as 100% (right panel). Individual donors are indicated with different symbols, and the same donors/symbols are used in the two panels. B. Example of primary flow cytometry data showing GFP expression in the GFP-positive subpopulation of DC, representing a single donor; cells were treated with a IFNAR2-blocking antibody or the isotype control antibody and infected with wt RSV or ΔNS1/2 RSV.
FIG. 7.
FIG. 7.
Effect of IFNAR2 blockade on the cell surface expression of maturation markers on DC in response to infection with wt RSV or the various gene deletion viruses. A. Expression of maturation markers CD86, CD83, and CD38 by DC, from three donors, in which IFNAR2 was blocked prior to infection. The values are expressed relative to the control cells that had been treated with the isotype control antibody prior to infection, which was assigned the value of 100%. The mean values are shown by horizontal bars, and statistical significance of each reduction compared to the corresponding isotype antibody control is shown by asterisks: *, P < 0.05; **, P < 0.01; ***, P < 0.001. Individual donors are indicated with different symbols, and the same donors/symbols are used in the three panels. B. Representative primary flow cytometry data showing expression of the maturation markers by DC. C. Expression CD38 by GFP-positive and GFP-negative fractions of DC, with primary flow cytometry data for wt RSV and ΔNS1/2 in GFP-positive and GFP-negative fractions of DC from one representative donor.
FIG. 8.
FIG. 8.
Concentrations of the cytokine TNF-α and the chemokines RANTES/CCL5 and MIP-1β/CCL4 in the medium from DC that were treated with the IFNAR2-blocking antibody, or an isotype control, prior to infection with the indicated viruses at an input MOI of 2. Medium samples were taken at 20 h and 40 h after virus inoculation and were analyzed by ELISA. The values for DC from three individual donors (TNF-α and RANTES/CCL5) and one donor (MIP-1β/CCL4) are shown and are expressed relative to the isotype control taken as 100%, with mean values shown as horizontal bars. Individual donors are indicated with different symbols, and the same donors/symbols are used in the three panels.
FIG. 9.
FIG. 9.
Effect of exogenously added IFN on DC maturation. Results show expression of CD38 by DC infected with the indicated viruses at an input MOI of 2, or treated with 1 μg/ml LPS, and then treated 24 h later with 1,000 IU/ml of IFN-α2 (A) or 800 IU/ml of IFN-β (B). Representative data are shown from one of three (A) or two (B) experiments performed with DC from different donors. GMI values of CD38 expression for IFN-nontreated and -treated DC are shown in each plot.

Similar articles

Cited by

References

    1. Arends, M. J., R. G. Morris, and A. H. Wyllie. 1990. Apoptosis. The role of the endonuclease. Am. J. Pathol. 136593-608. - PMC - PubMed
    1. Arimilli, S., M. A. Alexander-Miller, and G. D. Parks. 2006. A simian virus 5 (SV5) P/V mutant is less cytopathic than wild-type SV5 in human dendritic cells and is a more effective activator of dendritic cell maturation and function. J. Virol. 803416-3427. - PMC - PubMed
    1. Arimilli, S., J. B. Johnson, M. A. Alexander-Miller, and G. D. Parks. 2007. TLR-4 and -6 agonists reverse apoptosis and promote maturation of simian virus 5-infected human dendritic cells through NFkB-dependent pathways. Virology 365144-156. - PMC - PubMed
    1. Arnold, R., B. Konig, H. Galatti, H. Werchau, and W. Konig. 1995. Cytokine (IL-8, IL-6, TNF-alpha) and soluble TNF receptor-I release from human peripheral blood mononuclear cells after respiratory syncytial virus infection. Immunology 85364-372. - PMC - PubMed
    1. Banchereau, J., and R. M. Steinman. 1998. Dendritic cells and the control of immunity. Nature 392245-252. - PubMed

Publication types

MeSH terms