Comparative Study
. 2008 Sep;326(3):700-16.
doi: 10.1124/jpet.108.140186. Epub 2008 Jun 18.

Circadian variations in rat liver gene expression: relationships to drug actions

Affiliations
Comparative Study

Circadian variations in rat liver gene expression: relationships to drug actions

Richard R Almon et al. J Pharmacol Exp Ther. 2008 Sep.

Abstract

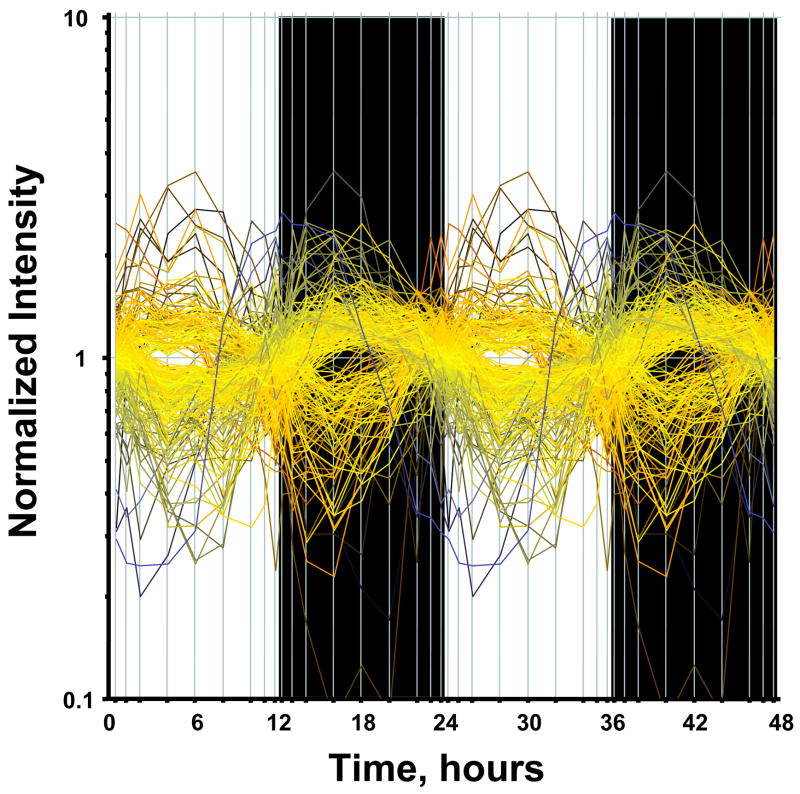
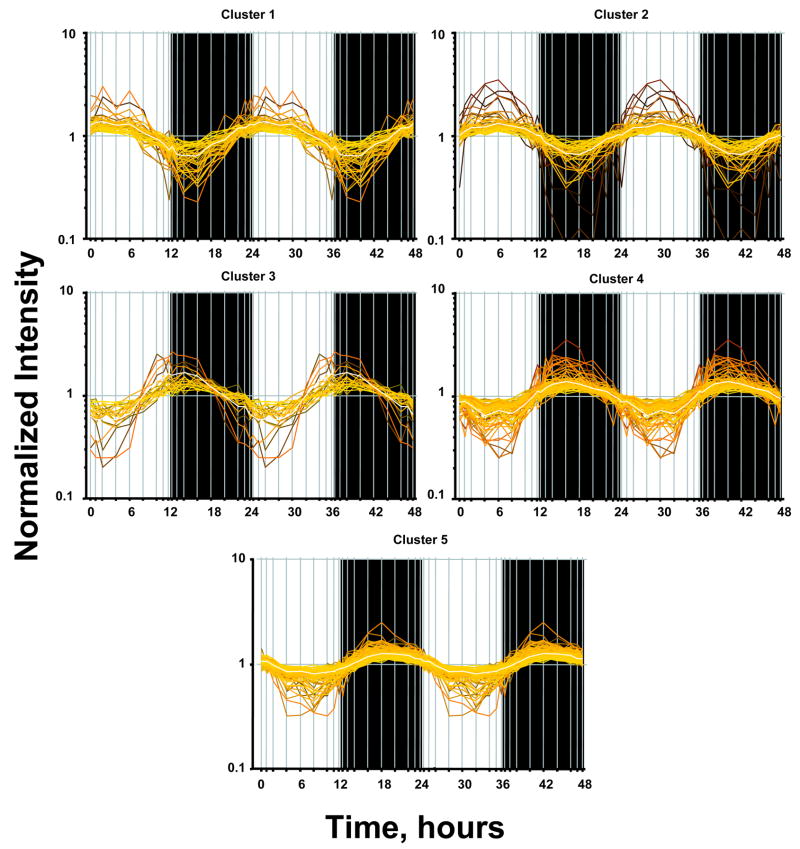
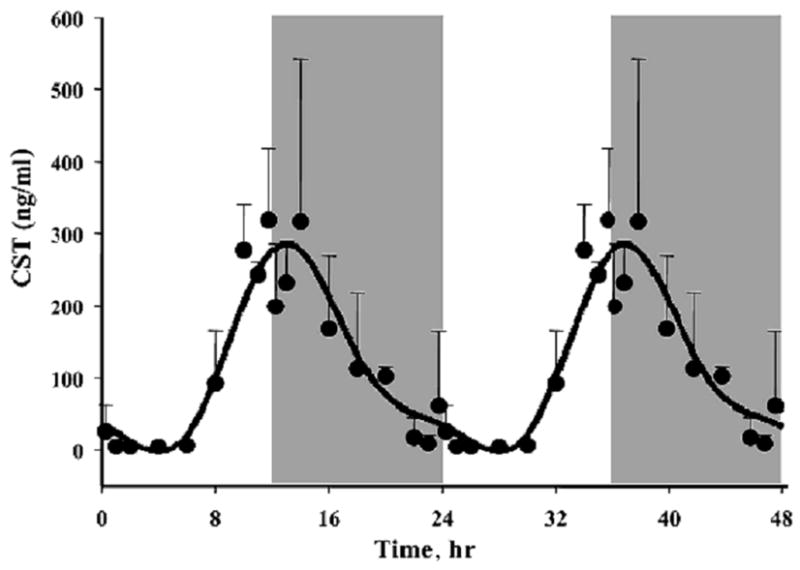
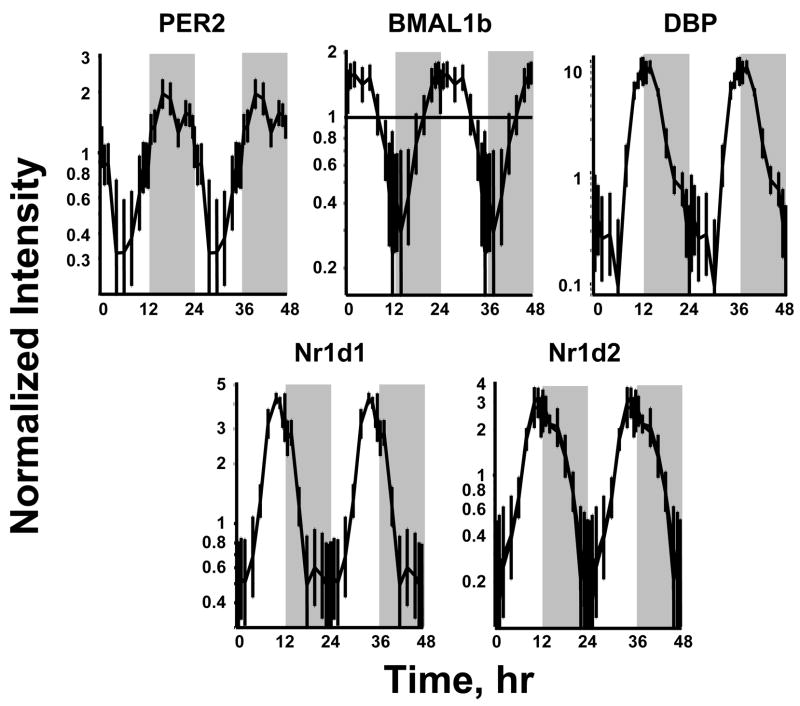
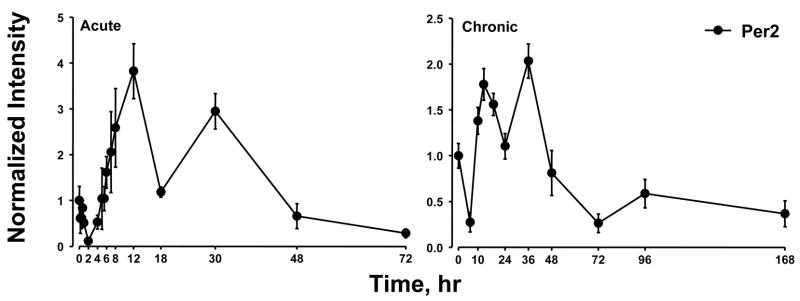
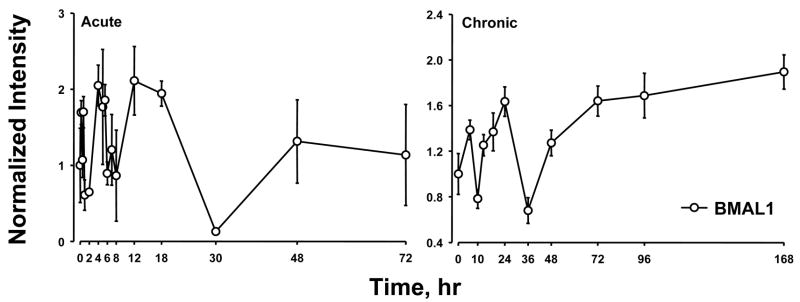
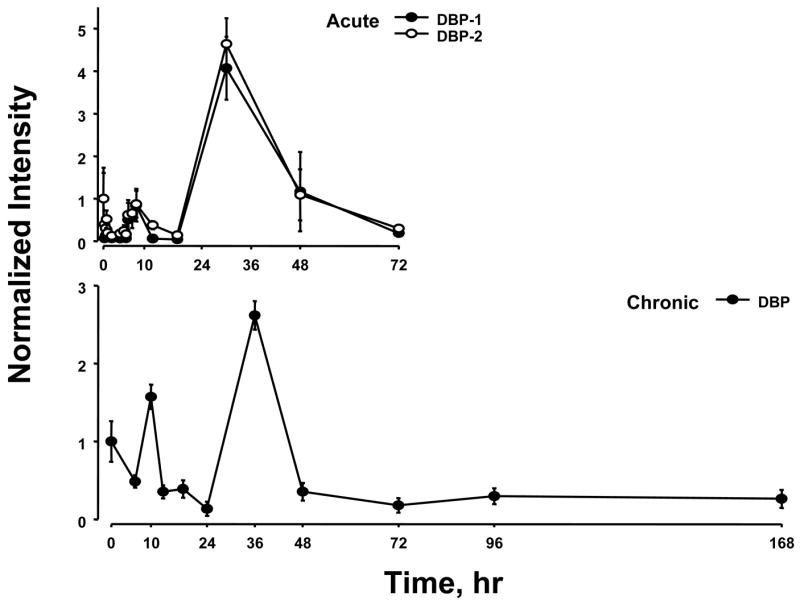
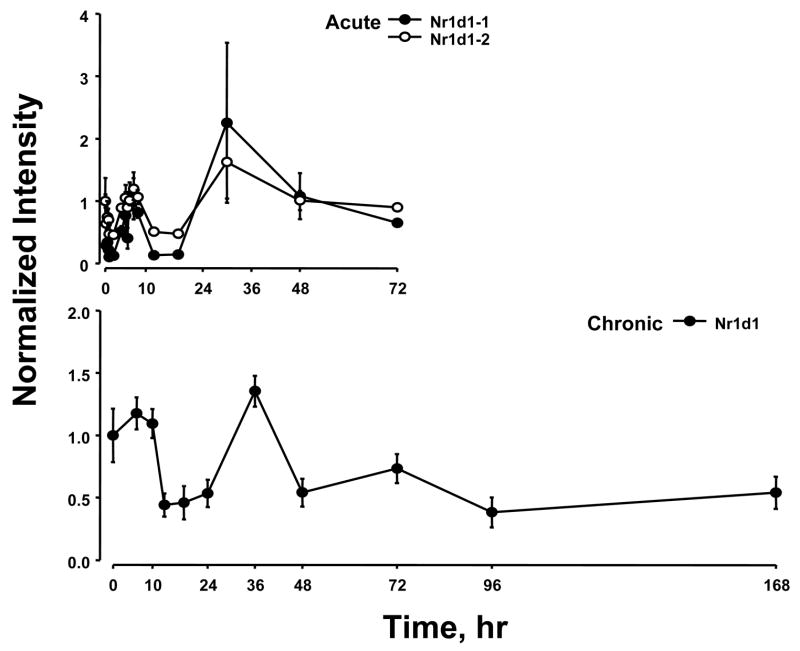
Chronopharmacology is an important but under-explored aspect of therapeutics. Rhythmic variations in biological processes can influence drug action, including pharmacodynamic responses, due to circadian variations in the availability or functioning of drug targets. We hypothesized that global gene expression analysis can be useful in the identification of circadian-regulated genes involved in drug action. Circadian variations in gene expression in rat liver were explored using Affymetrix gene arrays. A rich time series involving animals analyzed at 18 time points within the 24-h cycle was generated. Of the more than 15,000 probe sets on these arrays, 265 exhibited oscillations with a 24-h frequency. Cluster analysis yielded five distinct circadian clusters, with approximately two thirds of the transcripts reaching maximal expression during the dark/active period of the animal. Of the 265 probe sets, 107 were identified as having potential therapeutic importance. The expression levels of clock genes were also investigated in this study. Five clock genes exhibited circadian variation in the liver, and data suggest that these genes may also be regulated by corticosteroids.


Figures

Figure 1
Figure 1
Expression of circadian regulated genes. A non-linear curve fit using MATLAB was conducted which fitted a sinus function [A*sin(Bt + c)] to the data including the replicates. Genes that could be curve fitted with a R2 correlation of greater than 0.8 were kept.
Figure 2
Figure 2
QT clustering of circadian regulated genes. Each probe set has greater than a .75 Person’s correlation with the centroid of the cluster (shown in white0.
Figure 3
Figure 3
Plasma corticosterone (CST) as a function of circadian time as measured by HPLC. Symbols represent means and error bars 1 sd of the mean. Unshaded areas indicate light period and shaded areas indicate dark period.
Figure 4
Figure 4
Expression patterns of 5 clock related transcription factors in liver as a function of circadian time. Unshaded areas indicate light periods and shaded areas indicate dark periods.
Figure 5
Figure 5
Expression patterns of PER2 as a function of time after MPL administration to adrenalectomized animals. Left panels present data from acute (bolus 50 mg/kg) MPL dosing; right panels present data from chronic (0.3 mg/kg/h) MPL infusion. Array signals are normalized to zero time control values, and plotted as mean relative intensity at each time point. Error bars represent 1 sd of the mean.
Figure 6
Figure 6
Expression patterns of BMAL1 as a function of time after MPL administration to adrenalectomized animals. Left panels present data from acute (bolus 50 mg/kg) MPL dosing; right panels present data from chronic (0.3 mg/kg/h) MPL infusion. Array signals are normalized to zero time control values, and plotted as mean relative intensity at each time point. Error bars represent 1 sd of the mean.
Figure 7
Figure 7
Expression patterns of DBP as a function of time after MPL administration to adrenalectomized animals. Upper panel presents data from acute (bolus 50 mg/kg) MPL dosing; lower panel presents data from chronic (0.3 mg/kg/h) MPL infusion. Array signals are normalized to zero time control values, and plotted as mean relative intensity at each time point. Error bars represent 1 sd of the mean. The array used for the acute experiments contained 2 probe sets for DBP, and both are presented.
Figure 8
Figure 8
Expression patterns of Nr1d1 as a function of time after MPL administration to adrenalectomized animals. Upper panel presents data from acute (bolus 50 mg/kg) MPL dosing; lower panel presents data from chronic (0.3 mg/kg/h) MPL infusion. Array signals are normalized to zero time control values, and plotted as mean relative intensity at each time point. Error bars represent 1 sd of the mean. The array used for the acute experiments contained 2 probe sets for Nr1d1, and both are presented.
Figure 9
Figure 9
Expression patterns of Nr1d2 as a function of time after MPL administration to adrenalectomized animals. Upper panel presents data from acute (bolus 50 mg/kg) MPL dosing; lower panel presents data from chronic (0.3 mg/kg/h) MPL infusion. Array signals are normalized to zero time control values, and plotted as mean relative intensity at each time point. Error bars represent 1 sd of the mean. The array used for the chronic experiments contained 2 probe sets for Nr1d2, and both are presented.

References

    1. Almon RR, Dubois DC, Jin JY, Jusko WJ. Pharmacogenomic responses of rat liver to methylprednisolone: an approach to mining a rich microarray time series. AAPS Journal. 2005;7:E156–194. - PMC - PubMed
    1. Almon RR, DuBois DC, Jusko WJ. A microarray analysis of the temporal response of liver to methylprednisolone: a comparative analysis of two dosing regimens. Endocrinology. 2007;148:2209–2225. - PMC - PubMed
    1. Badiu C. Genetic clock of biologic rhythms. Journal of Cellular & Molecular Medicine. 2003;7:408–416. - PMC - PubMed
    1. Basuroy UK, Gerner EW. Emerging concepts in targeting the polyamine metabolic pathway in epithelial cancer chemoprevention and chemotherapy. Journal of Biochemistry. 2006;139:27–33. - PubMed
    1. Binder EB, Salyakina D, Lichtner P, Wochnik GM, Ising M, Putz B, Papiol S, Seaman S, Lucae S, Kohli MA, Nickel T, Kunzel HE, Fuchs B, Majer M, Pfennig A, Kern N, Brunner J, Modell S, Baghai T, Deiml T, Zill P, Bondy B, Rupprecht R, Messer T, Kohnlein O, Dabitz H, Bruckl T, Muller N, Pfister H, Lieb R, Mueller JC, Lohmussaar E, Strom TM, Bettecken T, Meitinger T, Uhr M, Rein T, Holsboer F, Muller-Myhsok B. Polymorphisms in FKBP5 are associated with increased recurrence of depressive episodes and rapid response to antidepressant treatment. Nature Genetics. 2004;36:1319–1325. - PubMed

Publication types