Comparative Study
. 2008 Jun 18;28(25):6304-8.
doi: 10.1523/JNEUROSCI.0961-08.2008.

Invariance and sensitivity to intensity in neural discrimination of natural sounds

Affiliations
Comparative Study

Invariance and sensitivity to intensity in neural discrimination of natural sounds

Cyrus P Billimoria et al. J Neurosci. .

Abstract

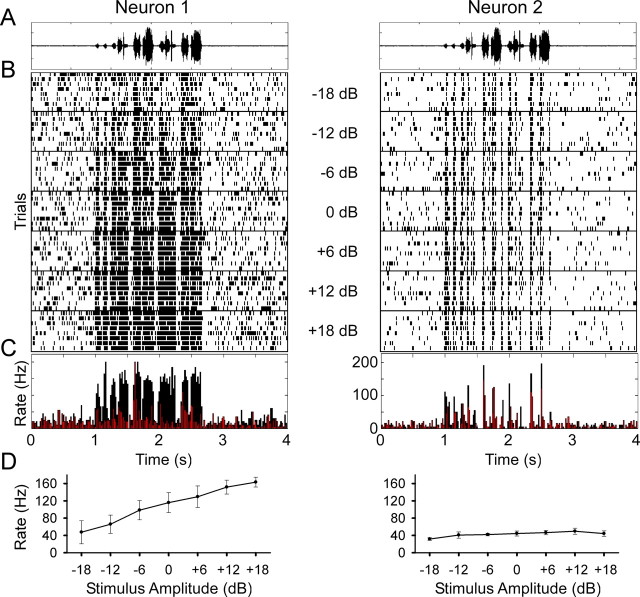
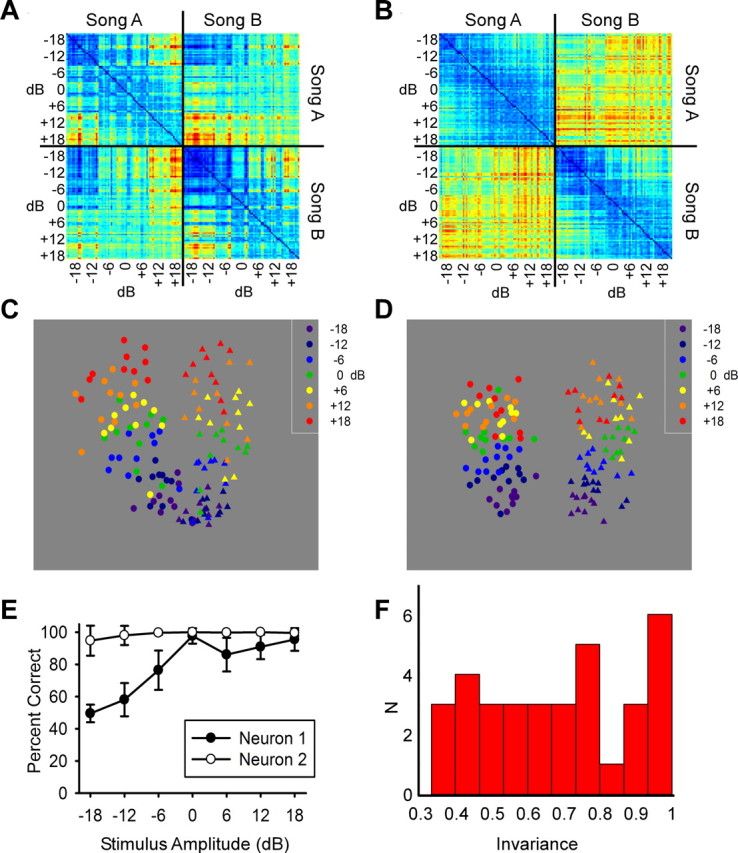
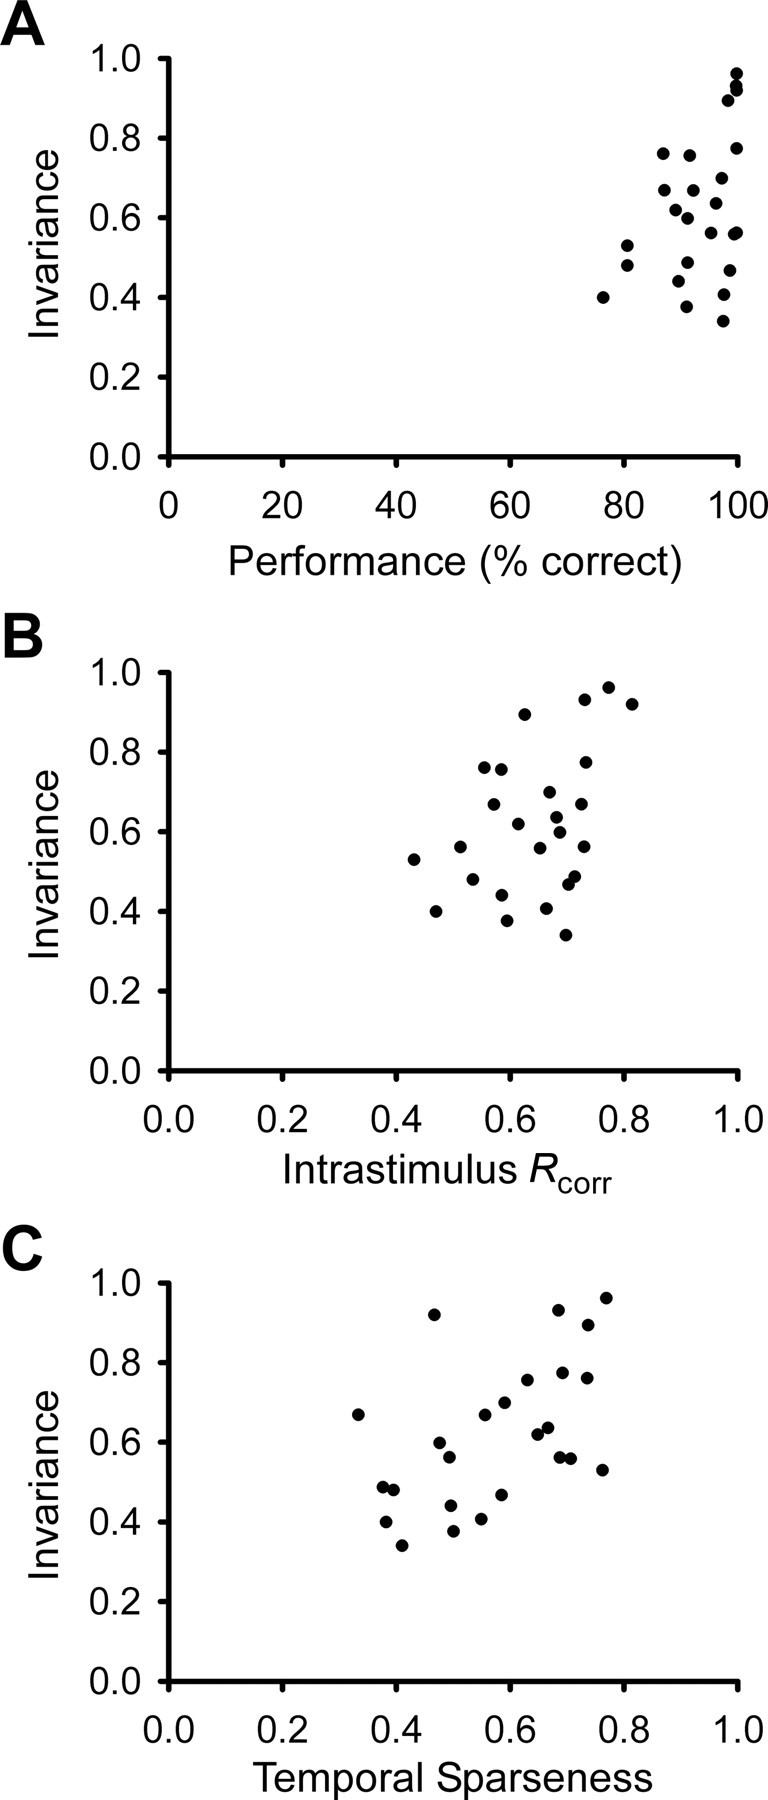
Intensity variation poses a fundamental problem for sensory discrimination because changes in the response of sensory neurons as a result of stimulus identity, e.g., a change in the identity of the speaker uttering a word, can potentially be confused with changes resulting from stimulus intensity, for example, the loudness of the utterance. Here we report on the responses of neurons in field L, the primary auditory cortex homolog in songbirds, which allow for accurate discrimination of birdsongs that is invariant to intensity changes over a large range. Such neurons comprise a subset of a population that is highly diverse, in terms of both discrimination accuracy and intensity sensitivity. We find that the neurons with a high degree of invariance also display a high discrimination performance, and that the degree of invariance is significantly correlated with the reproducibility of spike timing on a short time scale and the temporal sparseness of spiking activity. Our results indicate that a temporally sparse spike timing-based code at a primary cortical stage can provide a substrate for intensity-invariant discrimination of natural sounds.


Figures

Figure 1.
Figure 1.
Two example auditory neurons that show sensitivity (left) and invariance (right) to stimulus intensity. A, The song waveform. B, Stacked spike time rasters aligned in time with increasing amplitudes lower in the panel. A 6 dB increase in stimulus amplitude corresponds to a doubling of the amplitude. Each stimulus was presented randomly interleaved, and the responses to successive stimuli are separated by a horizontal line. C, Overlay of the peristimulus time histograms for the lowest (in red) and highest (in black) stimulus amplitudes. D, Plot of mean spike rate shows a significant increase in spike rate over the range of stimulus amplitudes (p < 0.001, 1-way repeated-measures ANOVA; error bars indicate SD of the mean) for neuron 1 and less (although still significant; p < 0.001, 1-way repeated-measures ANOVA; error bars indicate SD of the mean) variation in spike rates for neuron 2.
Figure 2.
Figure 2.
Auditory neurons show a range of invariant discrimination in field L, the primary auditory cortex analog. A, Spike distance matrix from the sensitive neuron shown in Figure 1 (left). All pairwise spike distances are shown for each of 10 trials, seven stimulus amplitudes, and two songs for a total of 140 spike trains. Spike trains 1–70 correspond to song A and 71–140 to song B. Spike distances were calculated using the van Rossum metric with a τ value of 10 ms using the first 1 s of each song. Warmer colors correspond to larger distances or more different spike trains. B, Spike distance matrix from invariant neuron shown in Figure 1 (right) using the same parameters as in A. C, MDS plot of relative spike distances in two dimensions for the sensitive neuron. D, MDS plot for the invariant neuron in the same MDS axes as C. E, Percentage of correct classification of two songs as a function of song amplitude for both an invariant (neuron 2) and a sensitive (neuron 1) neuron. Classification was done by measuring spike distance to two randomly chosen templates from the middle intensity (one from each song) and assigning the trial to the template with the shortest distance. F, Histogram of measure of intensity invariance based on flatness of percentage correct curve for each of the 34 sites in this study from field L that showed significant discrimination (better than halfway between chance and perfect) at any stimulus intensity. Larger numbers indicate more invariant discrimination.
Figure 3.
Figure 3.
Intensity-invariant neurons tend to show higher maximum discrimination accuracy, higher reliability and/or spike timing precision, and higher temporal sparseness. Correlation coefficients were calculated using the Pearson product moment test before and after using the arcsine transformation on the variables (see supplemental material, available at www.jneurosci.org). A, Intensity invariance tends to correlate with peak discrimination accuracy in scatter plot (N = 25, CC = 0.497, p = 0.011; before arcsine transform, CC = 0.400, p = 0.0474). B, Intensity invariance also significantly correlates with Rcorr, a measure of spike reliability and spike timing precision (N = 25, CC = 0.446, p = 0.026; before arcsine transform, CC = 0.414, p = 0.0397). Rcorr is a pairwise correlation measure, taken from spike trains with the same stimulus. C, There is a significant correlation between intensity invariance and temporal sparseness (N = 25, CC = 0.510, p = 0.009; before arcsine transform, CC = 0.515, p = 0.00836). Temporal sparseness is a measure of the firing rate distribution over time, calculated using a bin size of 10 ms (see Materials and Methods). Neurons with equal (or similar) firing rates in all bins would have a temporal sparseness value of (or near) 0, whereas neurons with a nonzero firing rate in only one (or a few) bin(s) would have a temporal sparseness index of (or near) 1.

Similar articles

Cited by

References

    1. Barak O, Tsodyks M. Recognition by variance: learning rules for spatiotemporal patterns. Neural Comput. 2006;18:2343–2358. - PubMed
    1. Bendor D, Wang X. The neuronal representation of pitch in primate auditory cortex. Nature. 2005;436:1161–1165. - PMC - PubMed
    1. Bendor D, Wang X. Differential neural coding of acoustic flutter within primate auditory cortex. Nat Neurosci. 2007;10:763–771. - PubMed
    1. Brody CD, Hopfield JJ. Simple networks for spike-timing-based computation, with application to olfactory processing. Neuron. 2003;37:843–852. - PubMed
    1. Buonomano DV, Merzenich M. A neural network model of temporal code generation and position-invariant pattern recognition. Neural Comput. 1999;11:103–116. - PubMed

Publication types

LinkOut - more resources