Comparative Study
. 2008 Jun 18;28(25):6508-15.
doi: 10.1523/JNEUROSCI.0678-08.2008.

Serotonin evokes endocannabinoid release and retrogradely suppresses excitatory synapses

Affiliations
Comparative Study

Serotonin evokes endocannabinoid release and retrogradely suppresses excitatory synapses

Aaron R Best et al. J Neurosci. .

Abstract

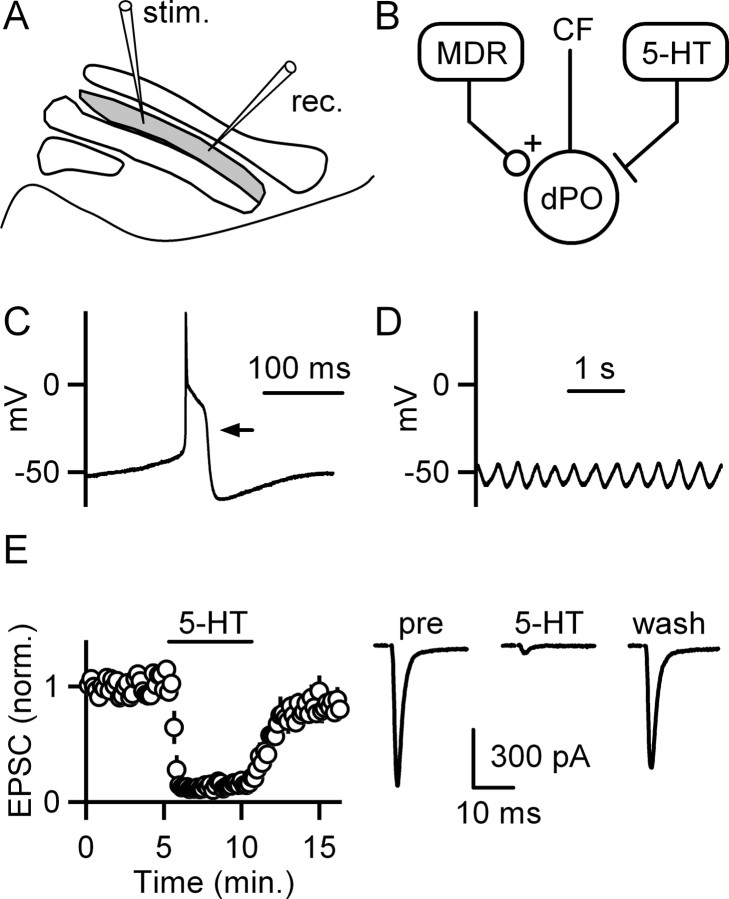
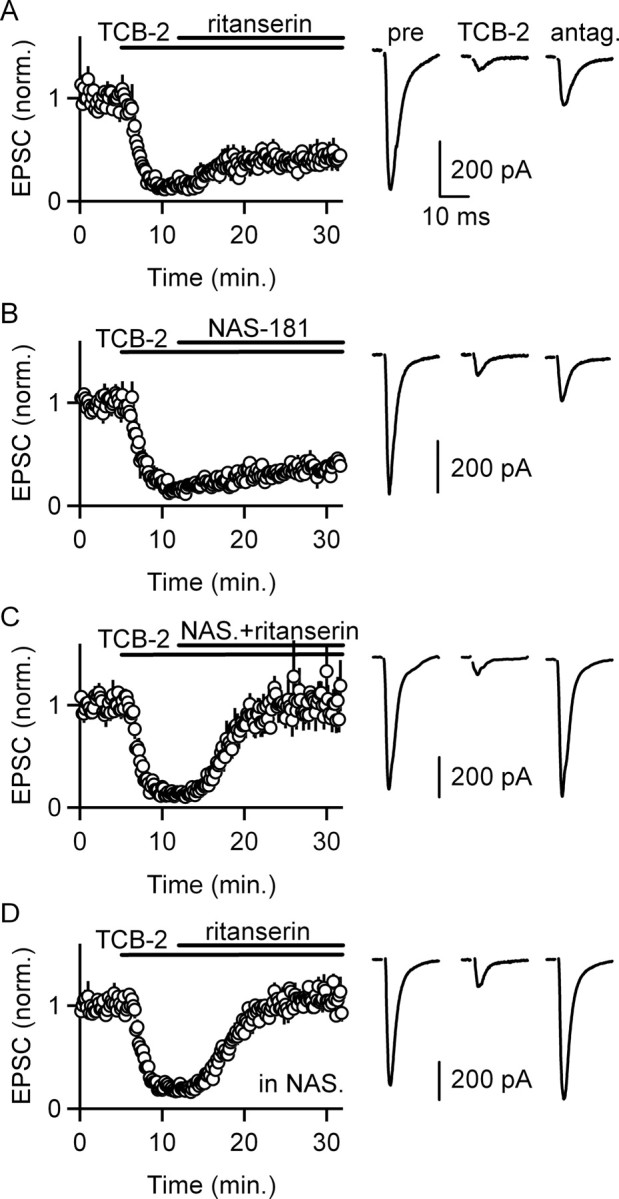
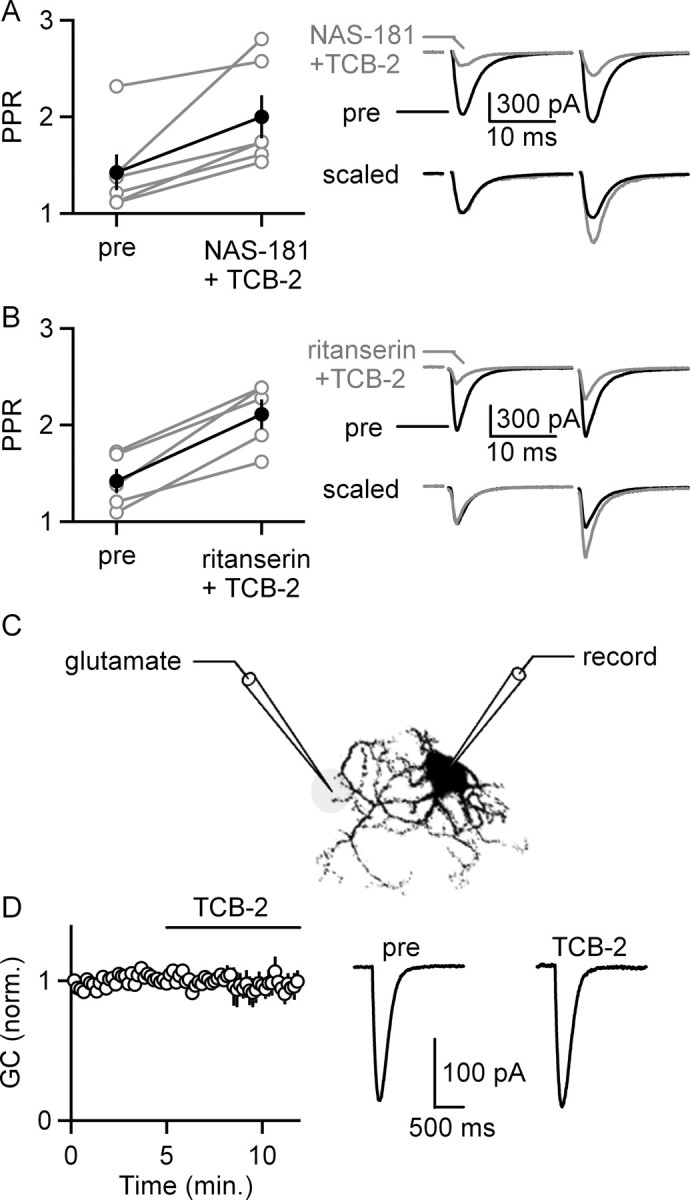
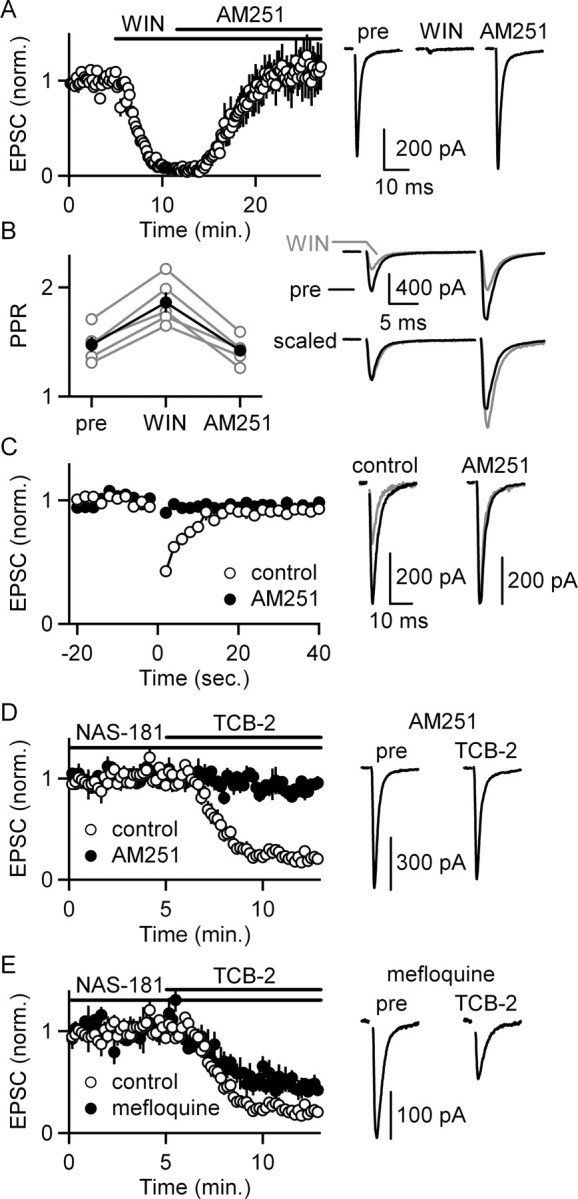
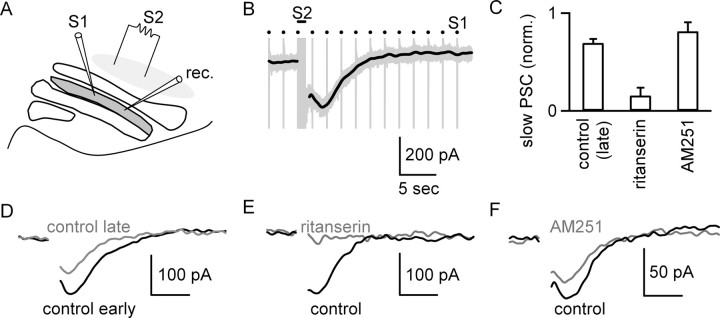
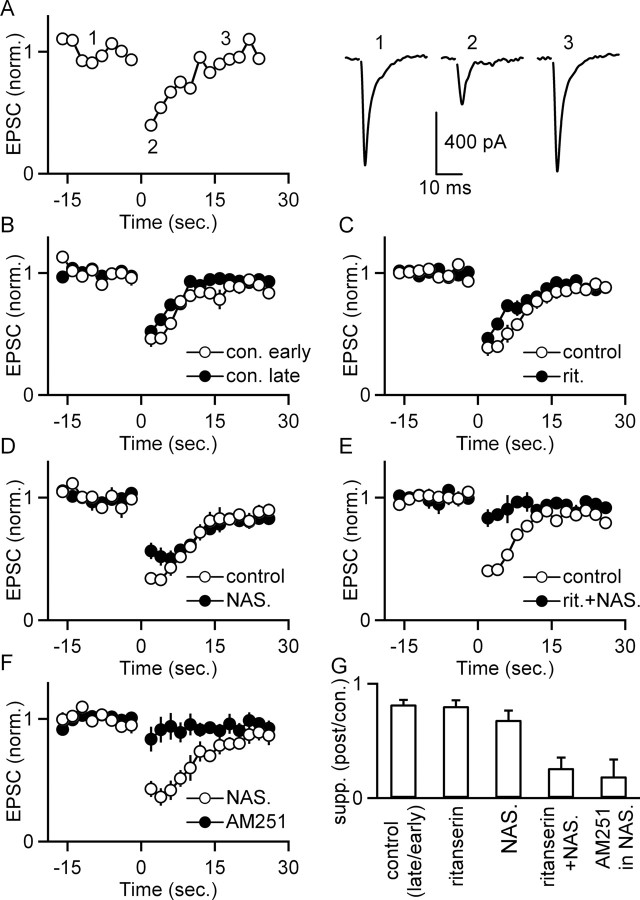
5-HT(2)-type serotonin receptors (5-HT(2)Rs) are widely expressed throughout the brain and mediate many of the modulatory effects of serotonin. It has been thought that postsynaptic 5-HT(2)Rs act primarily by depolarizing neurons and thereby increasing their excitability. However, it is also known that 5-HT(2)Rs are coupled to G(q/11)-type G-proteins and that some other types of G(q/11)-coupled receptors can regulate synapses by evoking endocannabinoid release and activating presynaptic cannabinoid-type 1 receptors (CB(1)Rs). Here, we examine whether activation of 5-HT(2)Rs can regulate synapses through such a mechanism by studying excitatory synapses onto cells in the inferior olive (IO). These cells express 5-HT(2)Rs on their soma and dendrites, and the IO receives extensive serotonergic input. We find that the excitatory synaptic inputs onto IO cells are strongly suppressed by serotonin receptor agonists as well as release of endogenous serotonin. Both 5-HT(2)Rs and 5-HT(1B)Rs contribute to this modulation by decreasing the probability of glutamate release from presynaptic boutons. The suppression by 5-HT(2)Rs is of particular interest because it is prevented by CB(1)R antagonists, and 5-HT(2)Rs are thought to be located only postsynaptically on IO cells. Our results indicate that serotonin activates 5-HT(2)Rs on IO neurons, thereby releasing endocannabinoids that act retrogradely to suppress glutamate release by activating presynaptic CB(1)Rs. These findings establish a link between serotonin signaling and endocannabinoid signaling. Based on the extensive distribution of 5-HT(2)Rs and CB(1)Rs, it seems likely that this mechanism could mediate many of the actions of 5-HT(2)Rs throughout the brain.


Figures

Figure 1.
Figure 1.
Excitatory synapses onto inferior olive neurons are suppressed by serotonin. A, A schematic of the slice preparation illustrates recording (rec.) and stimulation (stim.) sites within the dPO (gray) of the IO. B, A simplified circuit shows that neurons in MDRs provide excitatory synapses to neurons in the dPO. Brainstem nuclei provide a strong serotonergic (5-HT) input to the IO. Cells in the IO provide climbing fiber (CF) synapses whose primary target is Purkinje cells in the cerebellar cortex. C, Example recordings from dPO cells using a potassium-based pipette solution show a spontaneous action potential (C) and spontaneous subthreshold membrane potential oscillations (D). E, The effects of bath-applied 5-HT (10 μm) on EPSCs are illustrated by the time courses of EPSC amplitudes (left; n = 5 cells; means ± SEM) and by example traces from a representative experiment (right).
Figure 2.
Figure 2.
Activation of 5-HT2Rs and 5-HT1BRs suppresses EPSCs onto IO cells. A–D, Selective 5-HTR antagonists were used to characterize the receptors mediating the inhibition of EPSCs by the 5-HTR agonist TCB-2 (1 μm). Time courses of EPSC amplitudes (left column; n = 4 cells per condition) and example traces are shown (right column). The 5-HT2R antagonist ritanserin (4 μm) partially reversed the suppression of transmission (A), as did the 5-HT1BR antagonist NAS-181 (1 μm; B). C, Coapplication of ritanserin and NAS-181 reversed the suppression by TCB-2. D, In the presence of NAS-181, ritanserin completely reversed the suppression. Data are means ± SEM.
Figure 3.
Figure 3.
5-HT2R and 5-HT1BR activation presynaptically suppresses EPSCs onto IO cells. A, The selective activation of 5-HT2Rs by coapplying TCB-2 and NAS-181 increased the paired-pulse ratio (PPR). A summary plot shows the PPR for each experiment (open circles, left; n = 6 cells) and the average ± SEM PPR (filled circles, left). Traces are shown before and during bath application of TCB-2 (right). B, The selective activation of 5-HT1BRs by coapplying TCB-2 and ritanserin increased the paired-pulse ratio. A summary plot shows PPR for each experiment (open circles, left; n = 5 cells) and the average ± SEM PPR (filled circles, left). Traces are shown before and during bath application of TCB-2 (right). C, D, Pressure-applied glutamate was used to determine whether activation of 5-HT2Rs and/or 5-HT1BRs suppresses glutamatergic currents (GC) postsynaptically. C, A schematic illustrates the configuration used to apply glutamate onto an IO cell. D, Glutamate-evoked currents plotted as a function of time before and during TCB-2 application (left; n = 4 cells) and example traces from such an experiment are shown (right). Data are means ± SEM.
Figure 4.
Figure 4.
5-HT2R activation suppresses excitatory synapses onto IO cells by liberating endocannabinoids. A, Bath application of the CB1R agonist WIN (2 μm) suppresses EPSCs recorded from dPO cells, and the CB1R antagonist AM251 (4 μm) reverses this suppression. A summary of the time course of EPSC amplitudes (left; n = 5 cells) and traces from a representative experiment (right) are shown. B, WIN also increased paired-pulse ratio (PPR), and AM251 reversed this increase in PPR. A summary plot shows the PPR for each experiment (open circles, left) and the average ± SEM PPR (filled circles, left) compiled from data in A. Traces from a representative experiment are shown before (black) and during (gray) WIN application (right). C, Depolarizing dPO cells from −70 to 0 mV for 3 s (at t = 0) suppresses EPSCs for many seconds (open circles). This suppression is blocked by bath application of the CB1R antagonist AM251 (2 μm) (filled circles, left; n = 5 cells). Traces from a representative experiment are shown with the EPSCs measured before (black) and after (gray) depolarization in control conditions and in the presence of AM251. D, Blockade of CB1Rs with AM251 prevents the suppression of synaptic strength after 5-HT2R activation by applying TCB-2 in the presence of NAS-181 (left, filled circles; n = 4 cells). Example traces are shown (right). E, Blockade of gap junctions with mefloquine does not prevent the suppression of synaptic strength after 5-HT2R activation by applying TCB-2 in the presence of NAS-181 (left; n = 4 cells). Example traces are shown (right). Summaries of experiments conducted in control conditions are included for comparison (D, E, left, open circles). Example traces are shown (right). Data are means ± SEM.
Figure 5.
Figure 5.
Stimulation of serotonergic brainstem nuclei produces a slow postsynaptic current in IO cells. A, A schematic illustrates the experimental configuration used to assess the effects of activation of serotonergic brainstem nuclei that project to the IO. Electrode S1 was used to stimulate excitatory inputs, and electrode S2 was used to activate serotonergic fibers. B, Raw trace (gray) illustrates the response to stimulation of EPSCs at 0.5 Hz with S1 and stimulation of serotonergic brainstem nuclei with S2 (bar, 50 stimuli at 50 Hz), which produced a slow PSC. The slow PSC could be studied in isolation by removing the stimulus artifacts and low-pass filtering at 1 Hz (black trace). C, Bar graph summarizes the amplitude of the slow PSC measured in trials separated by 9 min, with the first trial in control conditions and the second trial, in either control conditions (n = 4 cells) or the presence of either ritanserin (n = 8 cells) or AM251 (n = 4 cells). D, Example slow PSCs recorded in early (black) and late (gray) control conditions. E, Example slow PSCs recorded before (black) and after (gray) the blockade of 5-HT2Rs with ritanserin. F, Example slow PSCs recorded in the presence of NAS-181 before (black) and after (gray) application of AM251. Data are means ± SEM.
Figure 6.
Figure 6.
Stimulation of serotonergic brainstem nuclei suppresses EPSCs onto IO cells. The effect of activation of serotonergic inputs (50 stimuli at 50 Hz) on EPSCs was assessed using the experimental configuration of Figure 5A. A, A representative experiment shows EPSC amplitudes as a function of time (left) recorded before and after stimulation at t = 0 of brainstem serotonergic nuclei. EPSCs recorded at the indicated times are displayed (right). In B–F, experiments were conducted in which eight trials such as these were repeated at 3 min intervals, and the amplitudes of EPSCs for the first two trials (open circles) and last three trials (filled circles) were compared. In B, the entire experiment was performed in control conditions. In C–F, drugs were bath applied after the second trial and remained present for the duration of the experiment. The antagonists applied were the 5-HT2R antagonist ritanserin (C), the 5-HT1BR antagonist NAS-181 (D), ritanserin and NAS-181 (E), and the CB1R antagonist AM251 (F). G, The extent of the suppression for B–F is summarized by dividing the suppression observed in the last three trains by the suppression observed in the first two trains for each condition (n = 4 cells for each condition; data are means ± SEM).

References

    1. Aghajanian GK, Marek GJ. Serotonin and hallucinogens. Neuropsychopharmacology. 1999;21:16S–23S. - PubMed
    1. Azizi SA, Woodward DJ. Inferior olivary nuclear complex of the rat: morphology and comments on the principles of organization within the olivocerebellar system. J Comp Neurol. 1987;263:467–484. - PubMed
    1. Barnes NM, Sharp T. A review of central 5-HT receptors and their function. Neuropharmacology. 1999;38:1083–1152. - PubMed
    1. Bishop GA, Ho RH. Cell bodies of origin of serotonin-immunoreactive afferents to the inferior olivary complex of the rat. Brain Res. 1986;399:369–373. - PubMed
    1. Bourrat F, Sotelo C. Postnatal development of the inferior olivary complex in the rat. I. An electron microscopic study of the medial accessory olive. Brain Res. 1983;284:291–310. - PubMed

Publication types

MeSH terms

LinkOut - more resources