

Mechanisms underlying angiotensin II-induced calcium oscillations
- PMID: 18562632
- PMCID: PMC2519179
- DOI: 10.1152/ajprenal.00107.2008
Mechanisms underlying angiotensin II-induced calcium oscillations
Abstract
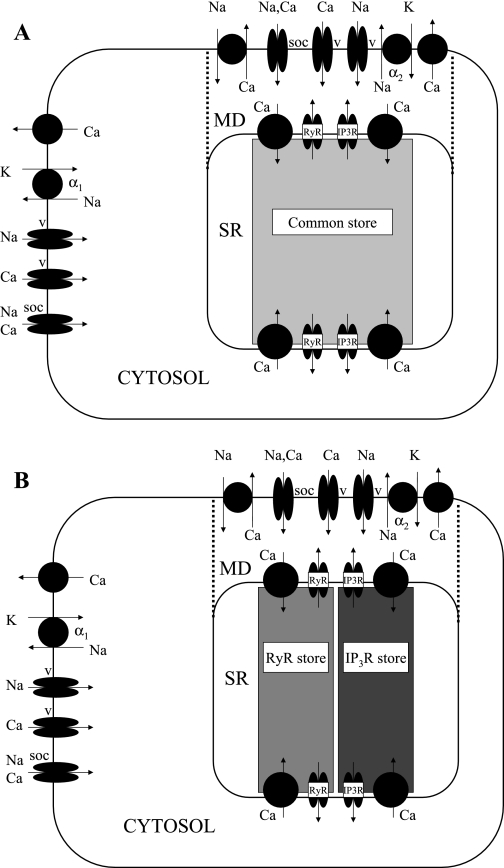
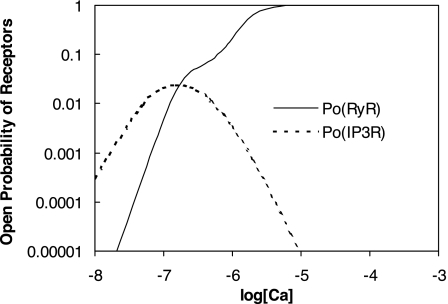
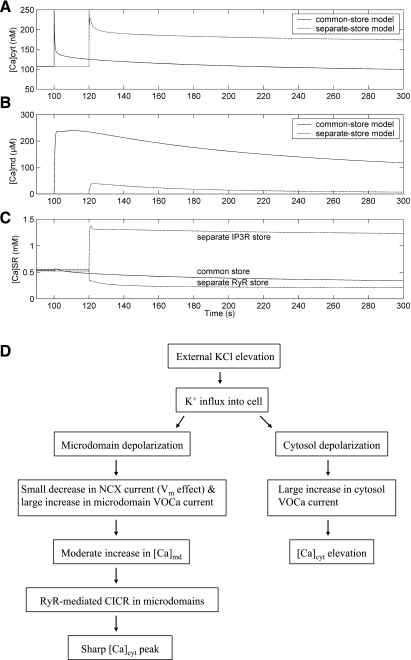
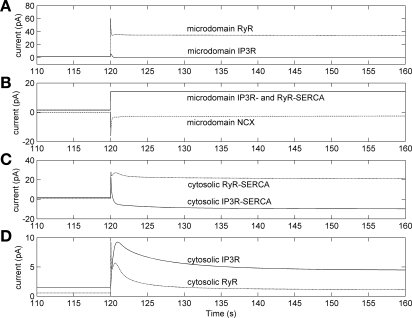
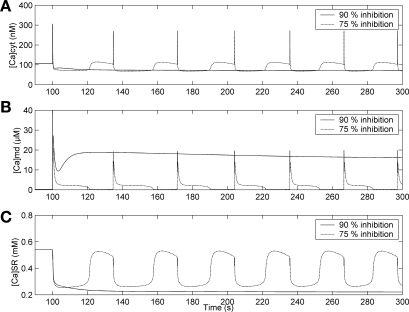
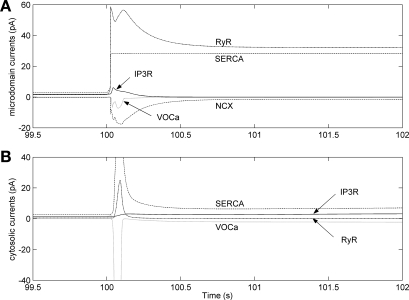
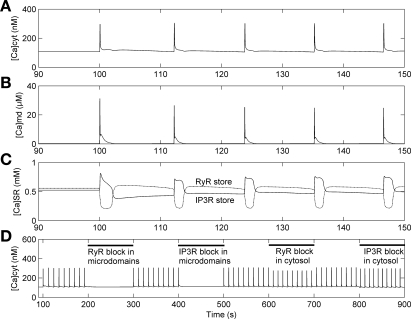
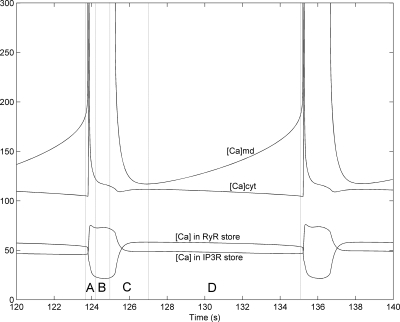
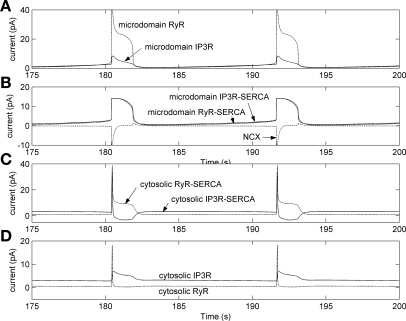
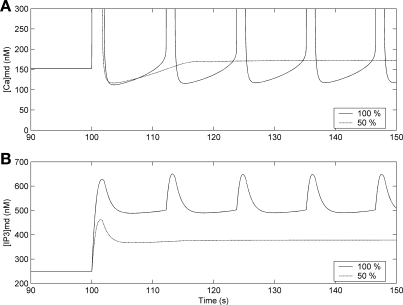
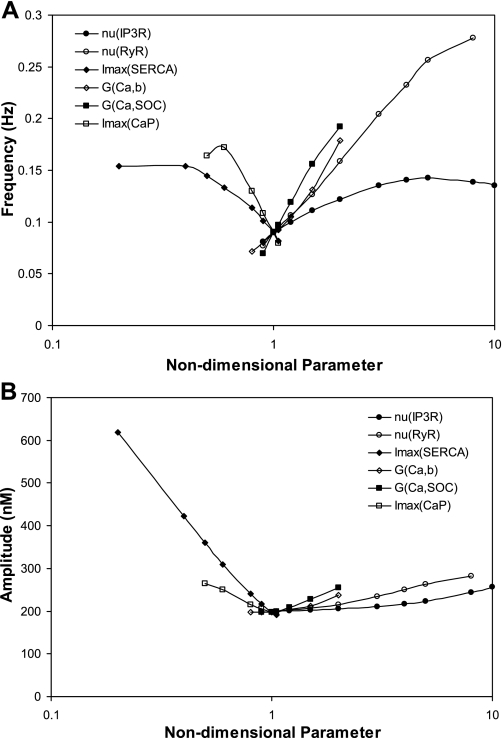
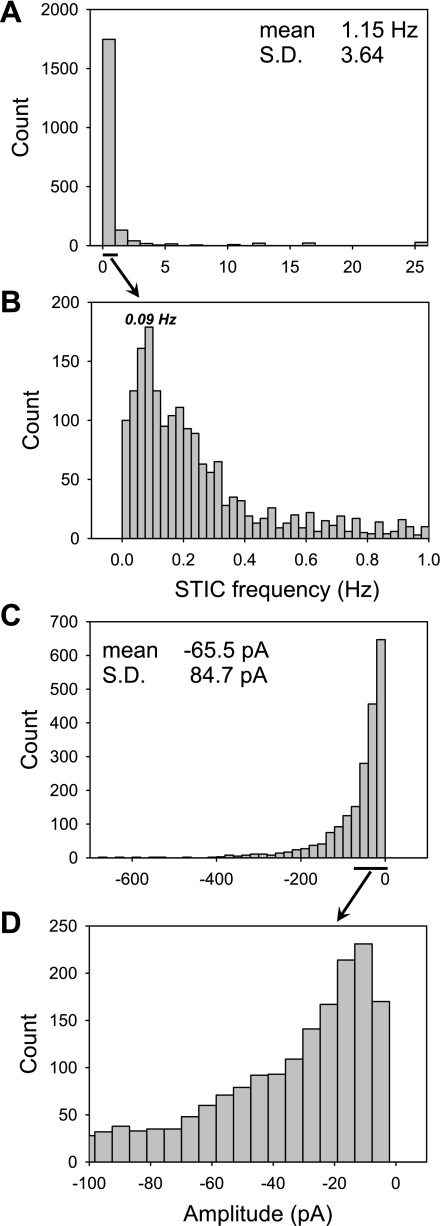
To gain insight into the mechanisms that underlie angiotensin II (ANG II)-induced cytoplasmic Ca2+ concentration ([Ca]cyt) oscillations in medullary pericytes, we expanded a prior model of ion fluxes. ANG II stimulation was simulated by doubling maximal inositol trisphosphate (IP3) production and imposing a 90% blockade of K+ channels. We investigated two configurations, one in which ryanodine receptors (RyR) and IP3 receptors (IP3R) occupy a common store and a second in which they reside on separate stores. Our results suggest that Ca2+ release from stores and import from the extracellular space are key determinants of oscillations because both raise [Ca] in subplasmalemmal spaces near RyR. When the Ca2+-induced Ca2+ release (CICR) threshold of RyR is exceeded, the ensuing Ca2+ release is limited by Ca2+ reuptake into stores and export across the plasmalemma. If sarco(endo)plasmic reticulum Ca2+-ATPase (SERCA) pumps do not remain saturated and sarcoplasmic reticulum Ca2+ stores are replenished, that phase is followed by a resumption of leak from internal stores that leads either to [Ca]cyt elevation below the CICR threshold (no oscillations) or to elevation above it (oscillations). Our model predicts that oscillations are more prone to occur when IP3R and RyR stores are separate because, in that case, Ca2+ released by RyR during CICR can enhance filling of adjacent IP3 stores to favor a high subsequent leak that generates further CICR events. Moreover, the existence or absence of oscillations depends on the set points of several parameters, so that biological variation might well explain the presence or absence of oscillations in individual pericytes.
Figures
Similar articles
-
Burst discharges in neurons of the thalamic reticular nucleus are shaped by calcium-induced calcium release.Cell Calcium. 2009 Nov-Dec;46(5-6):333-46. doi: 10.1016/j.ceca.2009.09.005. Epub 2009 Nov 14. Cell Calcium. 2009. PMID: 19913909
-
Dynamic imaging of endoplasmic reticulum Ca2+ concentration in insulin-secreting MIN6 Cells using recombinant targeted cameleons: roles of sarco(endo)plasmic reticulum Ca2+-ATPase (SERCA)-2 and ryanodine receptors.Diabetes. 2002 Feb;51 Suppl 1:S190-201. doi: 10.2337/diabetes.51.2007.s190. Diabetes. 2002. PMID: 11815480
-
Importance of Altered Levels of SERCA, IP3R, and RyR in Vascular Smooth Muscle Cell.Biophys J. 2017 Jan 24;112(2):265-287. doi: 10.1016/j.bpj.2016.11.3206. Biophys J. 2017. PMID: 28122214 Free PMC article.
-
Venous Vasomotion.Adv Exp Med Biol. 2019;1124:313-328. doi: 10.1007/978-981-13-5895-1_13. Adv Exp Med Biol. 2019. PMID: 31183833 Review.
-
Sarco-Endoplasmic Reticulum Calcium Release Model Based on Changes in the Luminal Calcium Content.Adv Exp Med Biol. 2020;1131:337-370. doi: 10.1007/978-3-030-12457-1_14. Adv Exp Med Biol. 2020. PMID: 31646517 Review.
Cited by
-
Cellular mechanisms underlying nitric oxide-induced vasodilation of descending vasa recta.Am J Physiol Renal Physiol. 2011 Feb;300(2):F441-56. doi: 10.1152/ajprenal.00499.2010. Epub 2010 Nov 17. Am J Physiol Renal Physiol. 2011. PMID: 21084408 Free PMC article.
-
Predicted effects of nitric oxide and superoxide on the vasoactivity of the afferent arteriole.Am J Physiol Renal Physiol. 2015 Oct 15;309(8):F708-19. doi: 10.1152/ajprenal.00187.2015. Epub 2015 Jul 15. Am J Physiol Renal Physiol. 2015. PMID: 26180238 Free PMC article.
-
The heart: mostly postmitotic or mostly premitotic? Myocyte cell cycle, senescence, and quiescence.Can J Cardiol. 2014 Nov;30(11):1270-8. doi: 10.1016/j.cjca.2014.08.014. Epub 2014 Aug 23. Can J Cardiol. 2014. PMID: 25442430 Free PMC article. Review.
-
Modeling transport in the kidney: investigating function and dysfunction.Am J Physiol Renal Physiol. 2010 Mar;298(3):F475-84. doi: 10.1152/ajprenal.00501.2009. Epub 2009 Nov 4. Am J Physiol Renal Physiol. 2010. PMID: 19889951 Free PMC article. Review.
-
Cardiac Hegemony of Senescence.Curr Transl Geriatr Exp Gerontol Rep. 2013 Dec;2(4):10.1007/s13670-013-0064-3. doi: 10.1007/s13670-013-0064-3. Curr Transl Geriatr Exp Gerontol Rep. 2013. PMID: 24349878 Free PMC article.
References
-
- Alexander R, Brock T, Gimbrone MJ, Rittenhouse S. Angiotensin increases inositol trisphosphate and calcium in vascular smooth muscle. Hypertension 7: 447–451, 1985. - PubMed
-
- Berridge MJ Inositol trisphosphate and calcium oscillations. Biochem Soc Symp 74: 1–7, 2007. - PubMed
-
- Berridge MJ, Lipp P, Bootman M. The versatility and universality of calcium signalling. Nat Rev Mol Cell Biol 1: 11–21, 2000. - PubMed
Publication types
MeSH terms
Substances
Grants and funding
LinkOut - more resources
Full Text Sources
Miscellaneous