. 2008 Jul;179(3):1513-25.
doi: 10.1534/genetics.107.084012. Epub 2008 Jun 18.

The temporal dynamics of processes underlying Y chromosome degeneration

Affiliations

The temporal dynamics of processes underlying Y chromosome degeneration

Doris Bachtrog. Genetics. 2008 Jul.

Abstract

Y chromosomes originate from ordinary autosomes and degenerate by accumulating deleterious mutations. This accumulation results from a lack of recombination on the Y and is driven by interference among deleterious mutations (Muller's ratchet and background selection) and the fixation of beneficial alleles (genetic hitchhiking). Here I show that the relative importance of these processes is expected to vary over the course of Y chromosome evolution due to changes in the number of active genes. The dominant mode of degeneration on a newly formed gene-rich Y chromosome is expected to be Muller's ratchet and/or background selection due to the large numbers of deleterious mutations arising in active genes. However, the relative importance of these modes of degeneration declines rapidly as active genes are lost. In contrast, the rate of degeneration due to hitchhiking is predicted to be highest on Y chromosomes containing an intermediate number of active genes. The temporal dynamics of these processes imply that a gradual restriction of recombination, as inferred in mammals, will increase the importance of genetic hitchhiking relative to Muller's ratchet and background selection.


Figures
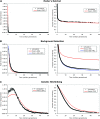
F<sc>igure</sc> 1.—
Figure 1.—
The rate of Y chromosome degeneration (i.e., the number of genes inactivated by deleterious mutations per generation) and the fraction of functional genes remaining over time, under different models of Y chromosome degeneration. Theoretical expectations are based on equations described in materials and methods, while the observed points (+) are from computer simulations. A Y chromosome initially carries g = 2000 active genes in a population of Ne = 10,000 chromosomes. The total mutation rate per gene u is assumed to be 5 × 10⁻⁵, which corresponds to an initial chromosomewide mutation rate of 0.1. Selection coefficients were varied, according to the model studied. (A) Muller's ratchet: Deleterious mutations of effect sd = 1.5% are modeled. (B) Background selection: 90% of the mutations are assumed to be strongly deleterious (sd = 3%) and cause a reduction in the effective population size (f0 = 0.05) but do not accumulate on the Y chromosome. The remaining 10% of mutations are weakly deleterious (sd,weak = 0.15%) and cause degeneration. Ten such weakly deleterious mutations are assumed to be required to inactivate a gene (see Figure 2). The blue theory line models mutation accumulation by the joint action of background selection and Muller's ratchet in a population of size Ne × f0. (C) Genetic hitchhiking: Deleterious mutations of effect sd = 3.5% are modeled. Beneficial mutations of effect sa = 6% are assumed to occur at a fraction 10−5 of the total mutation rate.
F<sc>igure</sc> 2.—
Figure 2.—
The effect of the number of mutations required to inactivate a gene (n_acc) on processes underlying Y chromosome degeneration. Red lines represent parameter values assumed in Figure 1. For each model, the rate of degeneration decreases with increasing n_acc. However, over long evolutionary time periods, the number of genes inactivated on the Y is similar for different values of n_acc. Note that the fitness effects of accumulating mutations vary among models, following parameters used in Figure 1.
F<sc>igure</sc> 3.—
Figure 3.—
The effect of population size (Ne) on processes of Y chromosome degeneration. Red lines represent parameter values assumed in Figure 1. For the mutational parameters used, essentially no weakly deleterious mutations accumulate under the background selection model in a population of ≥50,000 Y chromosomes. Similarly, Muller's ratchet essentially stops in a population of size ≥1,000,000.
F<sc>igure</sc> 4.—
Figure 4.—
The effect of the number of active genes (g) present on a newly formed Y chromosome on processes of Y chromosome degeneration. Red lines represent parameter values assumed in Figure 1. For the parameters used, Muller's ratchet essentially does not operate on a Y chromosome containing <500 active genes. Similarly, essentially no weakly deleterious mutations accumulate under the background selection model if the Y chromosome contains ≤1000 active genes. Genetic hitchhiking operates even on very gene-poor Y chromosomes.
F<sc>igure</sc> 5.—
Figure 5.—
The effect of the deleterious selection coefficients (sd or sd,weak) on processes of Y chromosome degeneration. Red lines represent parameter values assumed in Figure 1. Muller's ratchet will essentially not operate if sd ≥ 3.5%. The genetic hitchhiking model requires sd < sa; for sd < 3% degeneration would occur by both genetic hitchhiking and Muller's ratchet (see Figure 8 for this effect).
F<sc>igure</sc> 6.—
Figure 6.—
The effect of (A) the beneficial selection coefficient (sa) and (B) the fraction of newly arising mutations that are beneficial (f) on the rate of Y chromosome degeneration by genetic hitchhiking. Red lines represent parameter values assumed in Figure 1. In this example, sd = 3.5% (as in Figure 1C). Genetic hitchhiking will not operate unless sa > sd.
F<sc>igure</sc> 7.—
Figure 7.—
Muller's ratchet with two classes of deleterious mutations. A population of Ne = 10,000 individuals is modeled, with a Y chromosome originally containing 2000 genes. I assume that one mutation of effect sd,strong = 1.5% or three mutations with sd,weak = 0.5% are required to inactivate a gene. (A) A two-class vs. one-class model of fitness effects for a given mutation rate. All simulations assume a mutation rate of ud = 5 × 10⁻⁵/gene (i.e., a chromosomewide mutation rate Ud = 0.1). Results shown in red are for simulations where both types of mutations are modeled simultaneously, occurring at frequency of fstrong = 0.5 and fweak = 0.5. Results shown in green are for simulations where all mutations are modeled to be of effect sd,weak and results in blue model all mutations of effect sd,strong. (B) A more detailed examination of the joint effects of weak and strong deleterious mutations. Simulations in red assume a mutation rate of ud = 5 × 10⁻⁵/gene, modeling weak and strong mutations simultaneously. Shown in red are the fractions of genes inactivated by strong mutations (triangles), weak mutations (diamonds), and their combined effects (the lighter red line, corresponding to red open circles in A). Black lines show the number of genes inactivated by weak or strong mutations occurring at the same rates but in isolation (ud = 2.5 × 10⁻⁵/gene). Both weakly and strongly deleterious mutations cause more degeneration in isolation than in the presence of a second class of deleterious mutations.
F<sc>igure</sc> 8.—
Figure 8.—
The dynamics of Y chromosome degeneration under the simultaneous operation of Muller's ratchet and genetic hitchhiking. Solid lines are theoretical predictions based on Bachtrog and Gordo (2004), while the observed points are from computer simulations. I model Ne = 10,000 Y chromosomes that initially carry g = 2000 active genes. The total mutation rate per gene u is assumed to be 5 × 10⁻⁵ (i.e., corresponding to a chromosomewide mutation rate of 0.1). Selection coefficients against deleterious mutations were set to sd = 1.5%, and beneficial mutations of effect sa = 6% are assumed to occur at a fraction 10−5 of the total mutation rate.
F<sc>igure</sc> 9.—
Figure 9.—
Temporal dynamics of mammalian Y chromosome evolution. Different parts of the mammalian sex chromosomes (strata 1–4) were incorporated into the nonrecombining region at different times (Lahn and Page 1999; Skaletsky et al. 2003). A distribution of selection coefficients for deleterious mutations has recently been estimated (Yampolsky et al. 2005; Eyre-Walker et al. 2006), and three types of mutations are modeled here: beneficial mutations (sa = 1%) (Voight et al. 2006) occurring at a fraction f = 10−5 of the total mutation rate, strongly deleterious mutations that cause a reduction in the effective population size of Y chromosomes but do not accumulate (sd,BS = 1%; f = 0.25), and deleterious mutations of intermediate effect that accumulate under Muller's ratchet (sd,MR = 0.1%; f = 0.15). The remaining mutations are either effectively neutral (f = 0.2) or strongly deleterious and cause only a negligible reduction in Ne (f = 0.4) (Yampolsky et al. 2005; Eyre-Walker et al. 2006). The total mutation rate is assumed to be 3.6 × 10⁻⁵/gene and generation (Eyre-Walker and Keightley 1999). I assume a population size for mammals of 5 × 10⁵ males and a generation time of 1 year. Under these parameters, deleterious mutations of effect sd,MR can accumulate either by Muller's ratchet or by hitchhiking with beneficial mutations, and I modify the approximation proposed by Bachtrog and Gordo (2004) to calculate the rate of degeneration (see Figure 8). Each fixation of a deleterious mutation is assumed to inactivate a gene. The red line indicates genes remaining on the hypothetical Y chromosome, assuming that all 1000 genes stopped recombining at once (i.e., ignoring the evolutionary strata on the mammalian Y), while the green line accounts for the different ages of strata observed on the mammalian Y. The gray line shows Y degeneration ignoring beneficial mutations. The black arrows indicate the origin of the mammalian sex chromosomes ∼300 MYA, the present time, and the projected future after an additional 300 MY. Under the joint Muller's ratchet plus hitchhiking model, the Y chromosome of mammals is predicted to have ∼70 genes remaining at the present, which is close to the observed 78 protein-coding genes on the human Y (Skaletsky et al. 2003). Under the same model, the Y is predicted to still harbor ∼20 genes 300 MY in the future (ignoring future recruitment of new genes by additional fusions or transpositions).

References

    1. Aitken, R., and J. Marshall Graves, 2002. The future of sex. Nature 415 963. - PubMed
    1. Bachtrog, D., 2004. Evidence that positive selection drives Y-chromosome degeneration in Drosophila miranda. Nat. Genet. 36 518–522. - PubMed
    1. Bachtrog, D., 2005. Sex chromosome evolution: molecular aspects of Y chromosome degeneration in Drosophila. Genome Res. 15 1393–1401. - PMC - PubMed
    1. Bachtrog, D., and I. Gordo, 2004. Adaptive evolution of asexual populations under Muller's ratchet. Evol. Int. J. Org. Evol. 58 1403–1413. - PubMed
    1. Barton, N. H., and B. Charlesworth, 1998. Why sex and recombination? Science 281 1986–1990. - PubMed

Publication types