. 2008 Jul;179(3):1409-24.
doi: 10.1534/genetics.107.082198. Epub 2008 Jun 18.

Testing for neutrality in samples with sequencing errors

Affiliations

Testing for neutrality in samples with sequencing errors

Guillaume Achaz. Genetics. 2008 Jul.

Abstract

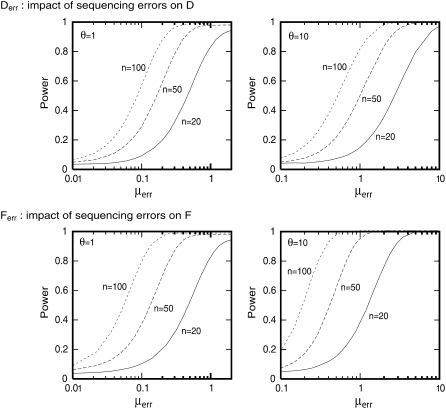
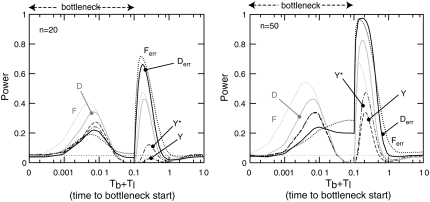
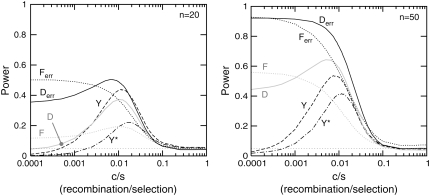
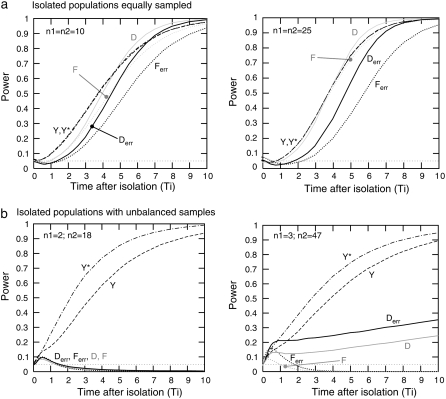
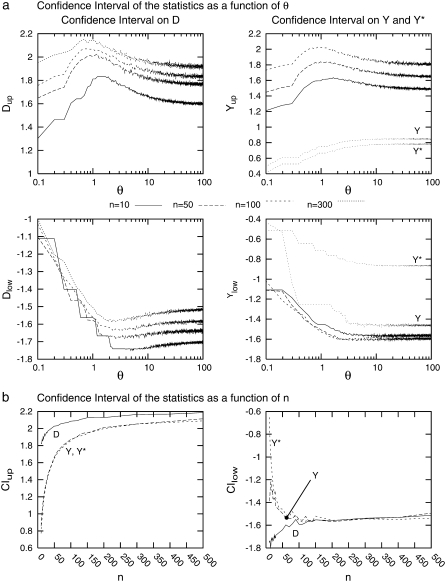
Many data sets one could use for population genetics contain artifactual sites, i.e., sequencing errors. Here, we first explore the impact of such errors on several common summary statistics, assuming that sequencing errors are mostly singletons. We thus show that in the presence of those errors, estimators of can be strongly biased. We further show that even with a moderate number of sequencing errors, neutrality tests based on the frequency spectrum reject neutrality. This implies that analyses of data sets with such errors will systematically lead to wrong inferences of evolutionary scenarios. To avoid to these errors, we propose two new estimators of theta that ignore singletons as well as two new tests Y and Y* that can be used to test neutrality despite sequencing errors. All in all, we show that even though singletons are ignored, these new tests show some power to detect deviations from a standard neutral model. We therefore advise the use of these new tests to strengthen conclusions in suspicious data sets.


Figures

F<sc>igure</sc> 1.—
Figure 1.—
Strong impact of sequencing errors on D and F, noted as Derr and Ferr, when μerr > 0. All 105 simulations were performed with n = 20, 50, 100, with θ = 1 (left) or θ = 10 (right) and a variable μerr. This rate of sequencing errors is defined for one sequence and for the whole locus, so that the number of errors is given by a Poisson law with mean nμerr. Sequencing errors artificially steer the statistics to negatives values. We report the power of the tests to reject the standard model. This shows that even when the sequencing error rate is moderate (0.01–0.1 of θ), the effect can be strong (especially when n is large).
F<sc>igure</sc> 2.—
Figure 2.—
Power of all tests to detect population expansion or decline. All 105 simulations were performed with θ = 10 and n = 20 (left) or n = 50 (right). The sequencing error rate was set either to μerr = 0 (D and F) or to μerr = 0.1 (Derr and Ferr). We report the power of all tests as a function of the total time since the bottleneck started. Bottlenecks are characterized by two times: Tl, the length of the bottleneck, and Tb, the time after the bottleneck. Here, the population size reduction is 1/100th and lasts for at most Tl = 0.1. A sample can be taken during the bottleneck (Tl + Tb ≤ 0.1) or after it has ended (Tl + Tb > 0.1). The graphs illustrate that depending on the how the frequency spectrum is skewed, the new tests performed either poorly (i.e., excess of low frequency: star-like trees) or honorably (i.e., excess of medium frequency: trees with stretched internal branches). They also illustrate that sequencing errors mask an excess of medium frequency and artificially enhance an excess of low frequency.
F<sc>igure</sc> 3.—
Figure 3.—
Impact of a selective sweep near the neutral locus under study. All 105 simulations were performed with θ = 10, α = 2Ns = 1000, Ts = 0.001 (the sample was taken right after the sweep) and n = 20 (left) or n = 50 (right). The sequencing error rate was set either to μerr = 0 (D and F) or to μerr = 0.1 (Derr and Ferr). Power is given as a function of c/s, the ratio between recombination and selection coefficients (although s is fixed). The graphs illustrate that when the recombination rate is very small, the new statistics have little or no power to detect a deviation, but, when the ratio c/s is in the order of 1/100, the new test with outgroup (based on Y) performs well. Finally, when it is very large, there is no more deviation from the standard model.
F<sc>igure</sc> 4.—
Figure 4.—
Power of all tests to detect deviation due to isolation (an extreme case of population structure). All 105 simulations were performed with θ = 10, N1 = N2 = Nanc/2, and n = 20 (left) or n = 50 (right). The sequencing error rate was set either to μerr = 0 (D and F) or to μerr = 0.1 (Derr and Ferr). (a) Deviation when the sampling is equilibrated between the populations (n1 = n2 = 10 or n1 = n2 = 25), as a function of the time to the isolation event (Ti). All tests exhibit very similar power to detect deviation from a standard model. (b) The sampling scheme is very unbalanced (n1 = 2, n2 = 18 or n1 = 3, n2 = 47). Interestingly, the test based on Y or Y* exhibits a stronger power than the one based on D.
F<sc>igure</sc> A1.—
Figure A1.—
Limits of the 95% confidence interval of of D, Y, and Y* as a function of θ and n. (a) The upper and lower limits of D (left), Y (right), and Y* (right). For n = 10, 50, 100, 300, we report the limits for θ varying between 0 and 100 with steps of 0.1. Values for Y and Y* for n > 10 are so similar that we cannot distinguish one from the other. This shows that, typically, the limits peak for small θ-values. (b) We report the most extreme limits for n ≤ 500. The conservative confidence-interval limits we computed, using our strategy, for n ≤ 500. Note that the upper limit of Y and Y* is different only for small values of n ≤ 15.

References

    1. Achaz, G., S. Palmer, M. Kearney, F. Maldarelli, J. W. Mellors et al., 2004. A robust measure of HIV-1 population turnover within chronically infected individuals. Mol. Biol. Evol. 21 1902–1912. - PubMed
    1. Berger, R., and D. Boos, 1994. P values maximized over a confidence set for the nuisance parameter. J. Am. Stat. Assoc. 89 1012–1016.
    1. Braverman, J. M., R. R. Hudson, N. L. Kaplan, C. H. Langley and W. Stephan, 1995. The hitchhiking effect on the site frequency spectrum of DNA polymorphisms. Genetics 140 783–796. - PMC - PubMed
    1. Depaulis, F., and M. Veuille, 1998. Neutrality tests based on the distribution of haplotypes under an infinite-site model. Mol. Biol. Evol. 15 1788–1790. - PubMed
    1. Depaulis, F., S. Mousset and M. Veuille, 2001. Haplotype tests using coalescent simulations conditional on the number of segregating sites. Mol. Biol. Evol. 18 1136–1138. - PubMed