. 2008 Oct;117(5):471-85.
doi: 10.1007/s00412-008-0167-3. Epub 2008 Jun 18.

Regulation of the meiotic prophase I to metaphase I transition in mouse spermatocytes

Affiliations

Regulation of the meiotic prophase I to metaphase I transition in mouse spermatocytes

Fengyun Sun et al. Chromosoma. 2008 Oct.

Abstract

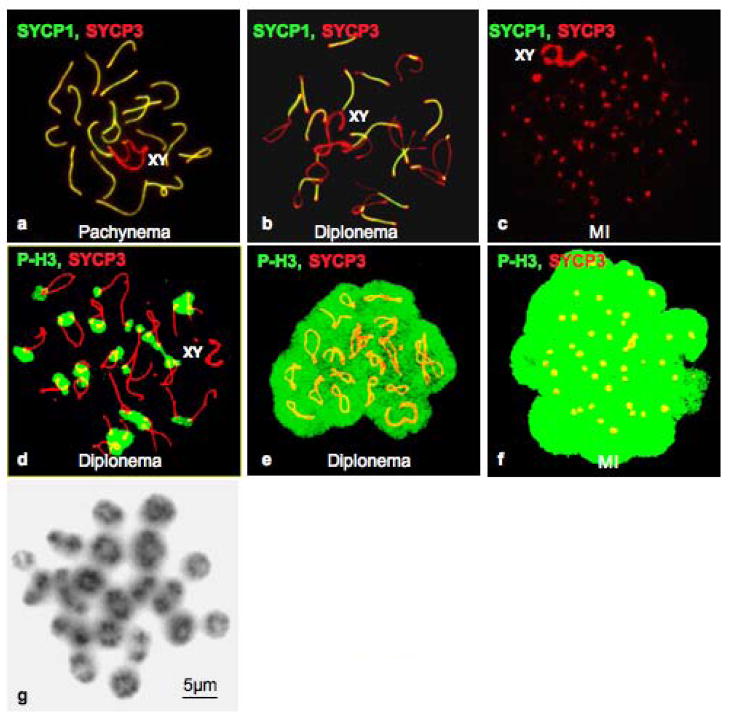
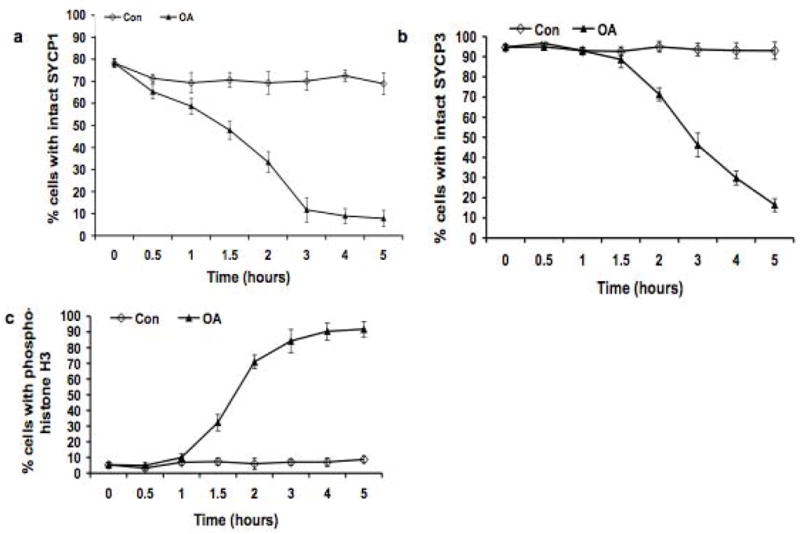
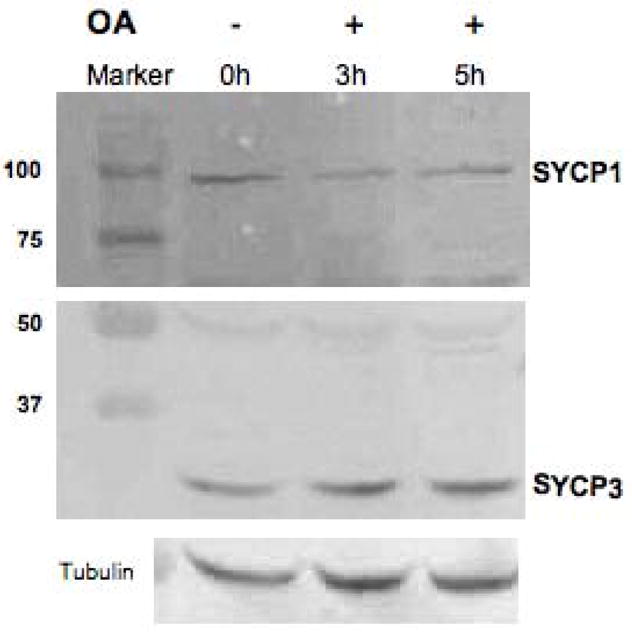
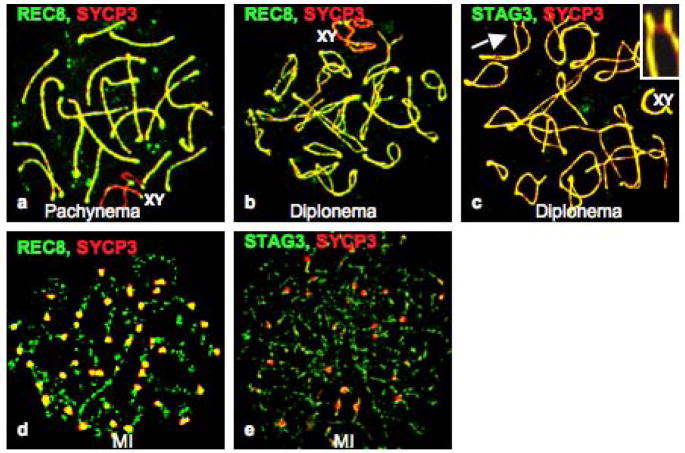
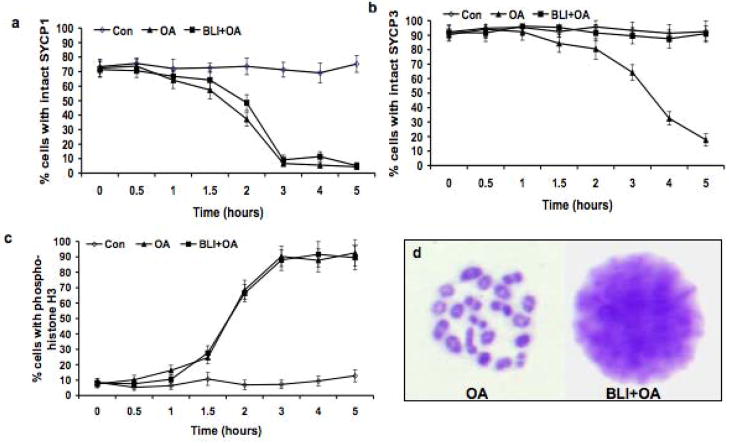
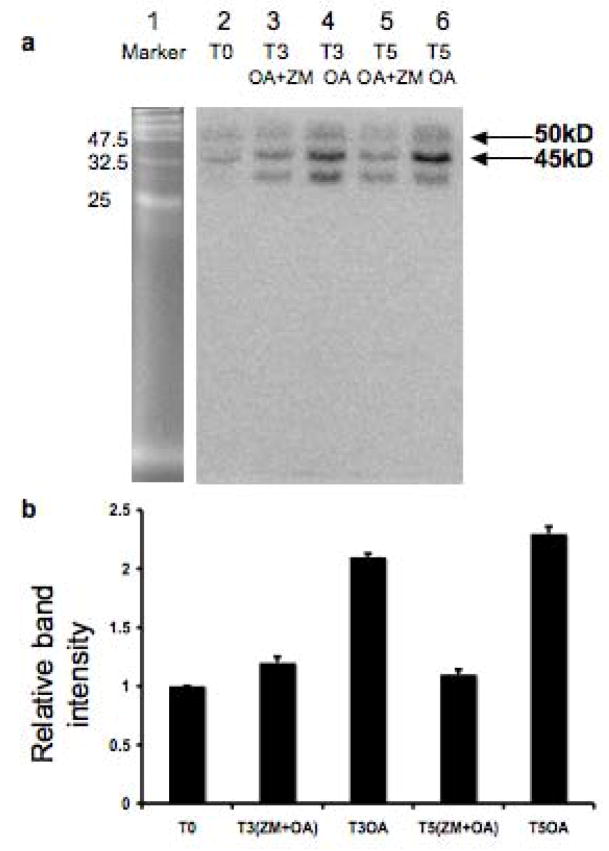
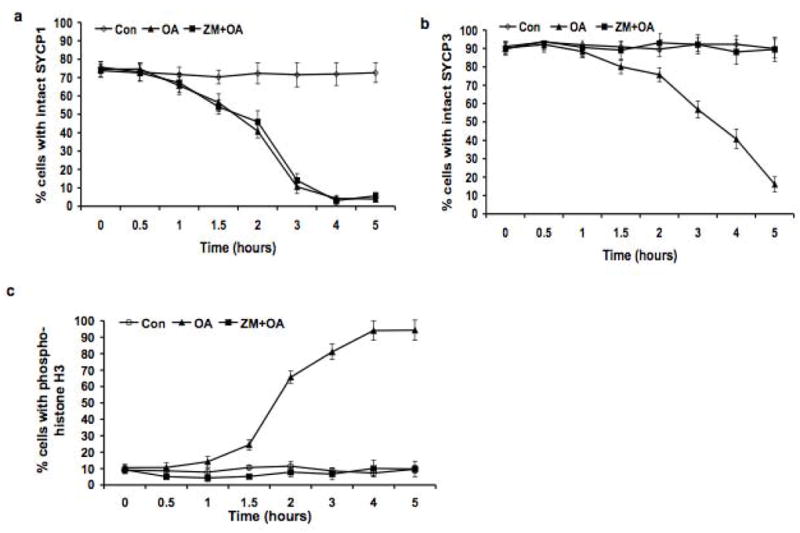
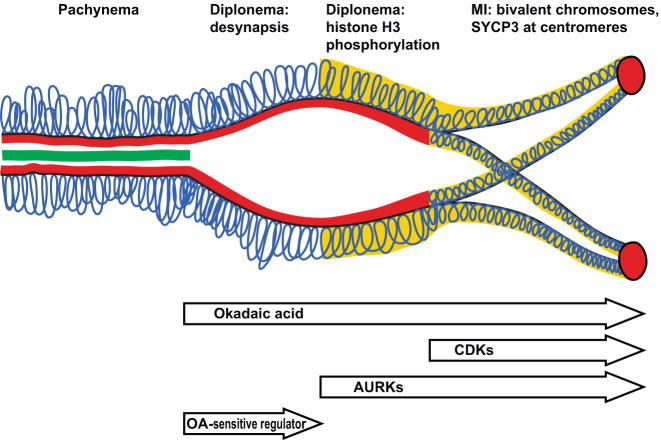
The meiotic prophase I to metaphase I transition (G2/MI) involves disassembly of synaptonemal complex (SC), chromatin condensation, and final compaction of morphologically distinct MI bivalent chromosomes. Control of these processes is poorly understood. The G2/MI transition was experimentally induced in mouse pachytene spermatocytes by okadaic acid (OA), and kinetic analysis revealed that disassembly of the central element of the SC occurred very rapidly after OA treatment, before histone H3 phosphorylation on Ser10. These events were followed by relocalization of SYCP3 and final condensation of bivalents. Enzymatic control of these G2/MI transition events was studied using small molecule inhibitors: butyrolactone I (BLI), an inhibitor of cyclin-dependent kinases (CDKs) and ZM447439 (ZM), an inhibitor of aurora kinases (AURKs). The formation of highly condensed MI bivalents and disassembly of the SC are regulated by both CDKs and AURKs. AURKs also mediate phosphorylation of histone H3 in meiosis. However, neither BLI nor ZM inhibited disassembly of the central element of the SC. Thus, despite evidence that the metaphase promoting factor is a universal regulator of the onset of cell division, desynapsis, the first and key step of the G2/MI transition, occurs independently of BLI-sensitive CDKs and ZM-sensitive AURKs.


Figures

Figure 1
Figure 1
Dynamics of SYCP1, SYCP3, phosphorylation of histone H3 on Ser10 labeling, and condensation of bivalents during the G2/MI transition in vitro. Labeling patterns of SYCP1 (green) and SYCP3 (red) are shown in pachynema (a), diplonema (b), and MI (c) during the OA-induced G2/MI transition in vitro. Different labeling patterns during the G2/MI transition in vitro for histone H3 phosphorylated on Ser10 (green) in diplonema and MI are shown in panels d–f. Respective stages of the cells were determined by the pattern of SYCP3 labeling (red). The sex bivalent is indicated as XY. Panel g. Giemsa staining reveals condensed bivalents in MI spermatocytes 5.0 hours after OA treatment.
Figure 2
Figure 2
Kinetic analysis of the dynamics of SYCP1, SYCP3 and appearance of histone H3 phosphorylated on Ser10 during the OA-induced G2/MI transition in vitro. The frequency (%) of cells with uninterrupted (intact), pachytene-like signal for SYCP1 and SYCP3 was scored. 200 cells were scored for SYCP1 and SYCP3, and the experiment was repeated three times (a total of 600 cells scored); 200 cells were scored for histone H3 phosphorylated on Ser10, and the experiment was repeated three times (a total of 600 cells scored). ◇: untreated control (Con) cells; ▴: cells treated with 5 μMOA (OA). Data are presented as means ± SEM.
Figure 3
Figure 3
Western blot detection of SYCP1 (top panel) and SYCP3 (middle panel) during the G2/MI transition in vitro (+ and − OA, 5 μM ), with α-tubulin used as a loading control (bottom panel). This analysis was repeated three times and a typical result is shown here.
Figure 4
Figure 4
Relocalization of the meiosis-specific cohesin subunits during the G2/MI transition in vitro. Panel a shows the relative localization of REC8 (green) and SYCP3 (red) in pachynema, and b shows their localization in diplonema. Panel c shows the absence of STAG3 (green, arrow) in an inter-homolog bridge labeled with anti-SYCP3 (red; arrow and enlargement in inset). The sex bivalent is indicated as XY. Panels d and e show the accumulation of SYCP3 (red) at centromeres at MI, when both REC8 (d, green) and STAG3 (e, green) are still present on chromosome arms.
Figure 5
Figure 5
Effects of BLI on the disassembly of the SCs and histone H3 phosphorylation on Ser10, and on condensation of bivalents. Panel a shows the dynamics of the removal of SYCP1 (desynapsis) in each experimental group. Panel b shows the removal of SYCP3 from the SC LEs in each experimental group. Panel c shows the increase in histone H3 phosphorylated on Ser10 in each experimental group. The frequency (%) of cells with uninterrupted (intact), pachytene-like signal for SYCP1 and SYCP3 was scored. 200 cells were scored for SYCP1 and SYCP3, and the experiment was repeated three times (a total of 600 cells scored); 200 cells were scored for phosphorylated histone H3, and the experiment was repeated three times (a total of 600 cells scored). ◇: untreated control (Con) cells; ▲: cells treated with 5 μMOA -treated (OA); ■ cells treated with 100 μM BLI + 5 μMOA (BLI + OA). The data are presented as means ± SEM. Panel d shows the patterns of chromatin condensation in OA-treated (left) and OA + BLI-treated spermatocytes (right).
Figure 6
Figure 6
OA activation and ZM inhibition of AURKs, as shown by an in-gel assay of aurora kinase activity. OA and ZM were used at the concentration of 5 μM and 5 μM, respectively, and cells were collected at 0 (T0), 3.0(T3), and 5.0 (T5) hours after incubation with or without treatment. Panel a is a representative gel, showing that OA -induced activation of AURKs is inhibited by ZM. The marker proteins were run on the same gel, and photographed before radioisotopic detection of kinase activity. The kinase activity migrating at 50 and 45 KDa is the appropriate size for active AURKA and AURKB, respectively (Crosio et al. 2002); the band below does not correspond to a known size for AURKs. Panel b shows the results of densitometric analysis of the 45 KDa AURKB band, where the activity of AURKs at T0 (time zero) was set as 1 for normalization of the other treatment groups This analysis was repeated three times. The data are presented as means ± SEM.
Figure 7
Figure 7
ZM inhibition of SYCP3 removal from SC LEs and histone H3 phosphorylation on Ser10, but not of removal of SYCP1 (desynapsis). Panel a shows the dynamics of the removal of SYCP1 (desynapsis) in each experimental group. Panel b shows the removal of SYCP3 from the SC LEs in each experimental group. Panel c shows the increase in histone H3 phosphorylated on Ser10 in each experimental group. The frequency (%) of cells with uninterrupted (intact), pachytene-like signal for SYCP1 and SYCP3 was scored. 200 cells were scored for SYCP1 and SYCP3, and the experiment was repeated three times (a total of 600 cells scored); 200 cells were scored for histone H3 phosphorylated on Ser10, and the experiment was repeated three times (a total of 600 cells scored). ◇: Untreated control (Con) cells; ▲: cells treated with 5 μMOA (OA); ■: cells treated with 5 μMZM + 5 μMOA (ZM + OA). The data are presented as means ± SEM.
Figure 8
Figure 8
A schematic representation of the G2/MI transition, reflecting the temporal course of events and differential inhibitor effects revealed in this study. At the pachytene stage, chromatin loops (blue) are attached to the SC LEs, marked by SYCP3 (red), and synapsis is mediated by SYCP1 (green) in the central element of the SC. OA (top arrow) prompts desynapsis and all subsequent events of the G2/MI transition. Desynapsis (removal of SYCP1 and disassembly of the SC central element) marks the onset of the diplotene stage. Histone H3 phosphorylated on Ser10 (yellow) accumulates in the chromatin during diplonema, but only after desynapsis occurs. Subsequently, the chromatin condenses further and SYCP3 is both removed and redistributed in the SC LEs to the centromeres and interchromatid patches, concurrent with condesation of bivalent chromosomes at MI. Inhibition of CDKs by BLI reveals that CDKs affect relocalization of SYCP3 and chromosome condensation. Inhibition of AURKs by ZM reveals that AURKs control phosphorylation of histone H3 on Ser10 in meiosis, as well as affecting subsequent events of SYCP3 relocalization and final condensation of bivalents. Neither BLI nor ZM affects OA-induced desynapsis; thus this event is controlled by an as-yet unidentified OA-sensitive regulator.

References

    1. Adams RR, Maiato H, Earnshaw WC, Carmena M. Essential roles of Drosophila inner centromere protein (INCENP) and aurora B in histone H3 phosphorylation, metaphase chromosome alignment, kinetochore disjunction, and chromosome segregation. J Cell Biol. 2001;153:865–880. - PMC - PubMed
    1. Allen JW, Dix DJ, Collins BW, Merrick BA, He C, Selkirk JK, Poorman-Allen P, Dresser ME, Eddy EM. Hsp70-2 is part of the synaptonemal complex in mouse and hamster spermatocytes. Chromosoma. 1996;104:414–421. - PubMed
    1. Arlot-Bonnemains Y, Klotzbucher A, Giet R, Uzbekov R, Bihan R, Prigent C. Identification of a functional destruction box in the Xenopus laevis aurora -A kinase pEg2. FEBS Lett. 2001;508:149–152. - PubMed
    1. Ashley T, Gaeth AP, Creemers LB, Hack AM, De Rooij DG. Correlation of meiotic events in testis sections and microspreads of mouse spermatocytes relative to the mid-pachytene checkpoint. Chromosoma. 2004;113:126–136. - PubMed
    1. Bannister LA, Reinholdt LG, Munroe RJ, Schimenti JC. Positional cloning and characterization of mouse mei8, a disrupted allelle of the meiotic cohesin Rec8. Genesis. 2004;40:184–194. - PubMed

Publication types

MeSH terms