. 2009 Jun;115(3):505-21.
doi: 10.1007/s10549-008-0093-3. Epub 2008 Jun 19.

Cyclopamine inhibition of human breast cancer cell growth independent of Smoothened (Smo)

Affiliations

Cyclopamine inhibition of human breast cancer cell growth independent of Smoothened (Smo)

Xiaomei Zhang et al. Breast Cancer Res Treat. 2009 Jun.

Abstract

Altered hedgehog signaling is implicated in the development of approximately 20-25% of all cancers, especially those of soft tissues. Genetic evidence in mice as well as immunolocalization studies in human breast cancer specimens suggest that deregulated hedgehog signaling may contribute to breast cancer development. Indeed, two recent studies demonstrated that anchorage-dependent growth of some human breast cancer cell lines is impaired by cyclopamine, a potent hedgehog signaling antagonist targeting the Smoothened (SMO) protein. However, specificity of cyclopamine at the dosage required for growth inhibition (> or =10 microM) remained an open question. In this paper we demonstrate that hedgehog signaling antagonists, including cyclopamine, and a second compound, CUR0199691, can inhibit growth of estrogen receptor (ER)-positive and ER-negative tumorigenic breast cancer cells at elevated doses. However, our results indicate that, for most breast cancer cell lines, growth inhibition by these compounds can be independent of detectable Smo gene expression. Rather, our results suggest that cyclopamine and CUR0199691 have unique secondary molecular targets at the dosages required for growth inhibition that are unrelated to hedgehog signaling.


Figures

Figure 1
Figure 1
Quantitative RT-PCR (Q-PCR) using untreated cells comparing hedgehog network gene expression across all cell lines tested. Data were analyzed using the ΔΔCT method in which expression of β-actin was used to normalize the relative expression of each gene within each cell line. Expression of each individual gene in brain mRNA was then used as the calibrator by which the cell lines could be normalized with one another for comparison of relative expression of hedgehog network genes across all cell lines. Data are expressed as the average quantification relative to expression in brain mRNA, with one standard error of the mean.
Figure 2
Figure 2
Hedgehog network gene expression in human breast cancer cell lines in response to 10ng/ml SHH-N ligand. Untreated values for each gene were normalized to “1”. Data are expressed as fold change relative to untreated cells, with one standard error. Statistically significant changes in gene expression are denoted by an asterisk (*) (two-sample t-test).
Figure 3
Figure 3
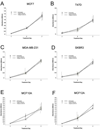
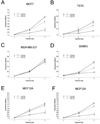
Dose response curves for growth of breast cancer cell lines in response to treatment with either 1ng/ml or 10ng/ml SHH-N ligand relative to untreated cells. MTS assays were performed on treatment days 1, 4, and 7. Mean absorbance for each treatment and day was plotted with 95% confidence intervals.
Figure 4
Figure 4
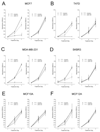
Dose response curves for growth of breast cancer cell lines in response to treatment with either cyclopamine or tomatidine. MTS assays were performed on treatment days 1, 4, and 7. Mean absorbance for each treatment and day was plotted with 95% confidence intervals.
Figure 5
Figure 5
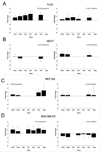
Ki67 expression and apoptosis in cyclopamine-sensitive and -resistant cell lines as a function of treatment. Proliferation is expressed as the percentage of Ki67+ cells determined by direct cell counts. Apoptosis is expressed as the percentage of Annexin V+ cells as determined by analytical flow cytometry. Results for three cell lines, MCF7, MDA-MB-231, and MCF10A are shown. Mean percentage of cell expression Ki67 or Annexin V in response to treatment was plotted with 95% confidence intervals. Statistical significance relative to untreated control is denoted by an asterisk (*) (contrasts within a one-way ANOVA).
Figure 6
Figure 6
Quantitative RT-PCR for hedgehog network gene expression as a function of treatment with 10µM cyclopamine or 10µM tomatidine relative to untreated cells using six cell lines. Untreated values for each gene were normalized to “1”. Data are expressed as fold change relative to untreated, with one standard error. Statistically significant changes in gene expression relative to untreated cells are denoted with an asterisk (*) (two-sample t-test).
Figure 7
Figure 7
Competition assays to determine whether the effect of cyclopamine on cell growth could be reversed upon treatment with increasing concentrations of recombinant SHH-N. The left panel of each pair for each cell line shows results with 10µM cyclopamine. The right panel of each pair shows results with 20µM cyclopamine. Mean absorbance for each treatment and day was plotted with 95% confidence intervals.
Figure 8
Figure 8
Determination of the molecular response of T47D cells to simultaneous cyclopamine and SHH ligand treatment. Untreated values for each gene were normalized to “1”. Data are expressed as fold change relative to untreated, with one standard error. A. Ptch1. B. Ptch2. C. Smo. D. Gli1. and E. Gli3. Statistically significant changes in gene expression relative to untreated controls are denoted by an asterisk (*)(two-sample t-test). Similarly, significant differences between either 10µM cyclopamine alone, or 10ng/ml SHH-N alone and combination treatment with both 10µM cyclopamine and 10ng/ml SHH-N are denoted by two asterisks (**) (two-sample t-test).
Figure 9
Figure 9
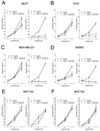
Dose response curves for growth of breast cancer cell lines in response to treatment with CUR0199691. MTS assays were performed on treatment days 1, 4, and 7. Note that CUR0199691 shows different cell type specificity from cyclopamine. Mean absorbance for each treatment and day was plotted with 95% confidence intervals.

References

    1. Lewis MT, Veltmaat JM. Next stop, the twilight zone: hedgehog network regulation of mammary gland development. J Mammary Gland Biol Neoplasia. 2004;9:165–181. - PubMed
    1. Hooper JE, Scott MP. Communicating with Hedgehogs. Nat Rev Mol Cell Biol. 2005;6:306–317. - PubMed
    1. Nusse R. Wnts and Hedgehogs: lipid-modified proteins and similarities in signaling mechanisms at the cell surface. Development. 2003;130:5297–5305. - PubMed
    1. Cohen MM., Jr The hedgehog signaling network. Am J Med Genet. 2003;123A:5–28. - PubMed
    1. Liu S, Dontu G, Mantle ID, et al. Hedgehog signaling and Bmi-1 regulate self-renewal of normal and malignant human mammary stem cells. Cancer Res. 2006;66:6063–6071. - PMC - PubMed

Publication types

MeSH terms