

MALDI-FTICR imaging mass spectrometry of drugs and metabolites in tissue
- PMID: 18564854
- PMCID: PMC2924168
- DOI: 10.1021/ac800617s
MALDI-FTICR imaging mass spectrometry of drugs and metabolites in tissue
Abstract
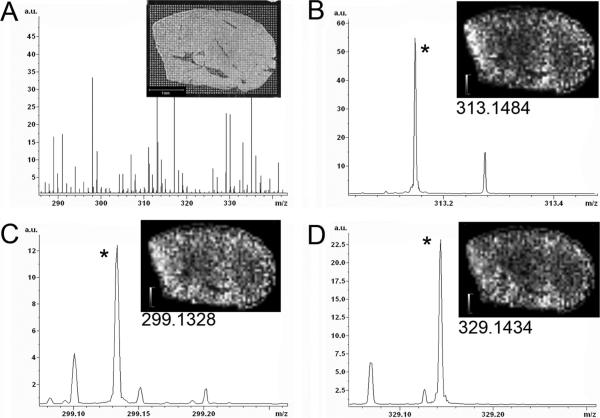
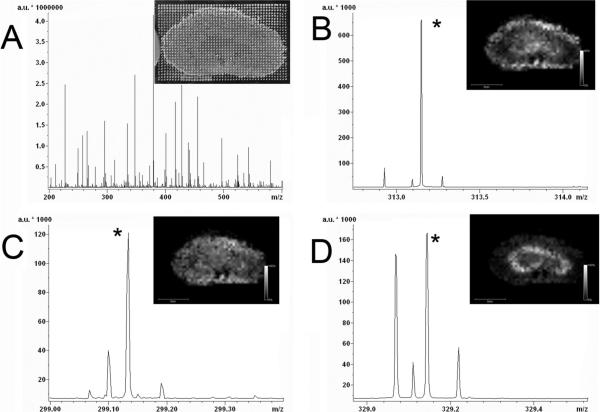
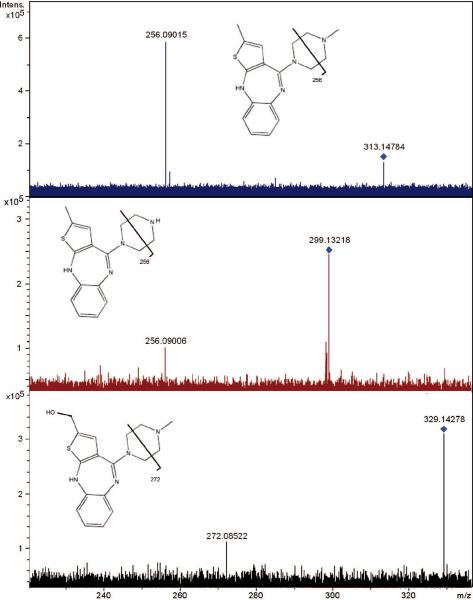
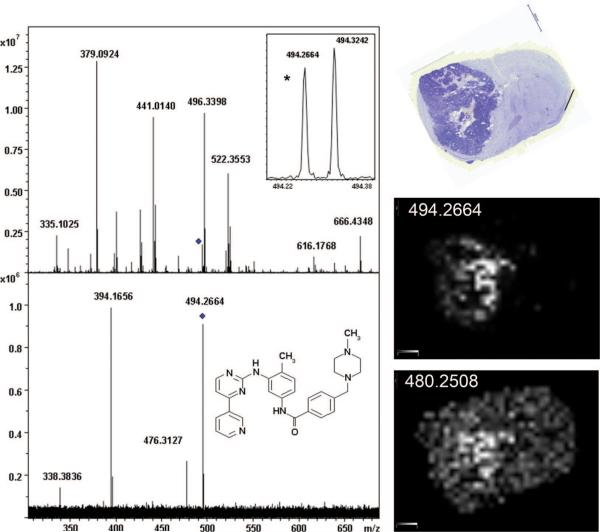
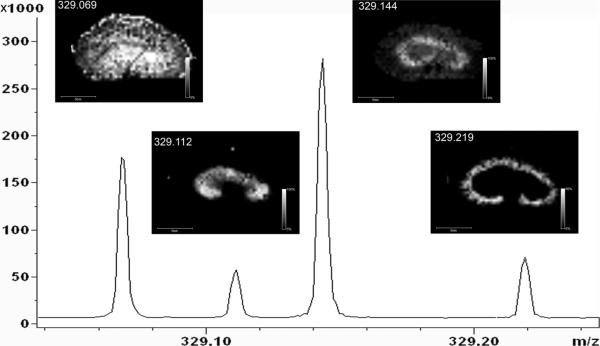
A new approach is described for imaging mass spectrometry analysis of drugs and metabolites in tissue using matrix-assisted laser desorption ionization-Fourier transform ion cyclotron resonance (MALDI-FTICR). The technique utilizes the high resolving power to produce images from thousands of ions measured during a single mass spectrometry (MS)-mode experiment. Accurate mass measurement provides molecular specificity for the ion images on the basis of elemental composition. Final structural confirmation of the targeted compound is made from accurate mass fragment ions generated in an external quadrupole-collision cell. The ability to image many small molecules in a single measurement with high specificity is a significant improvement over existing MS/MS based technologies. Example images are shown for olanzapine in kidney and liver and imatinib in glioma.
Figures
References
-
- Drexler DM, Garrett TJ, Cantone JL, Diters RW, Mitroka JG, Conaway MCP, Adams SP, Yost RA, Sanders M. J. Pharmacol. Toxicol. Methods. 2007;55:279–288. - PubMed
-
- Taban IM, Altelaar AFM, Van der Burgt YEM, McDonnell LA, Heeren RMA, Fuchser J, Baykut G. J. Am. Soc. Mass Spectrom. 2007;18:145–151. - PubMed
-
- Verhaert PD, Conaway MCP, Pekar TM, Miller K. Int. J. Mass Spectrom. 2007;260:177–184.
-
- Groseclose MR, Andersson M, Hardesty WM, Caprioli RM. J. Mass Spectrom. 2007;42:254–262. - PubMed
Publication types
MeSH terms
Substances
Grants and funding
LinkOut - more resources
Full Text Sources
Other Literature Sources
Medical
