

Modulation of T4 gene 32 protein DNA binding activity by the recombination mediator protein UvsY
- PMID: 18565541
- PMCID: PMC2527458
- DOI: 10.1016/j.jmb.2008.05.039
Modulation of T4 gene 32 protein DNA binding activity by the recombination mediator protein UvsY
Abstract
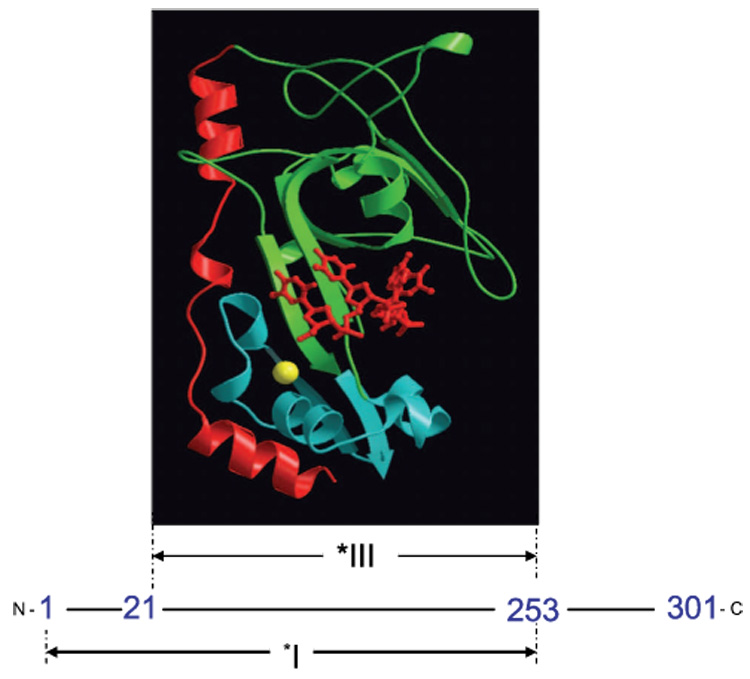
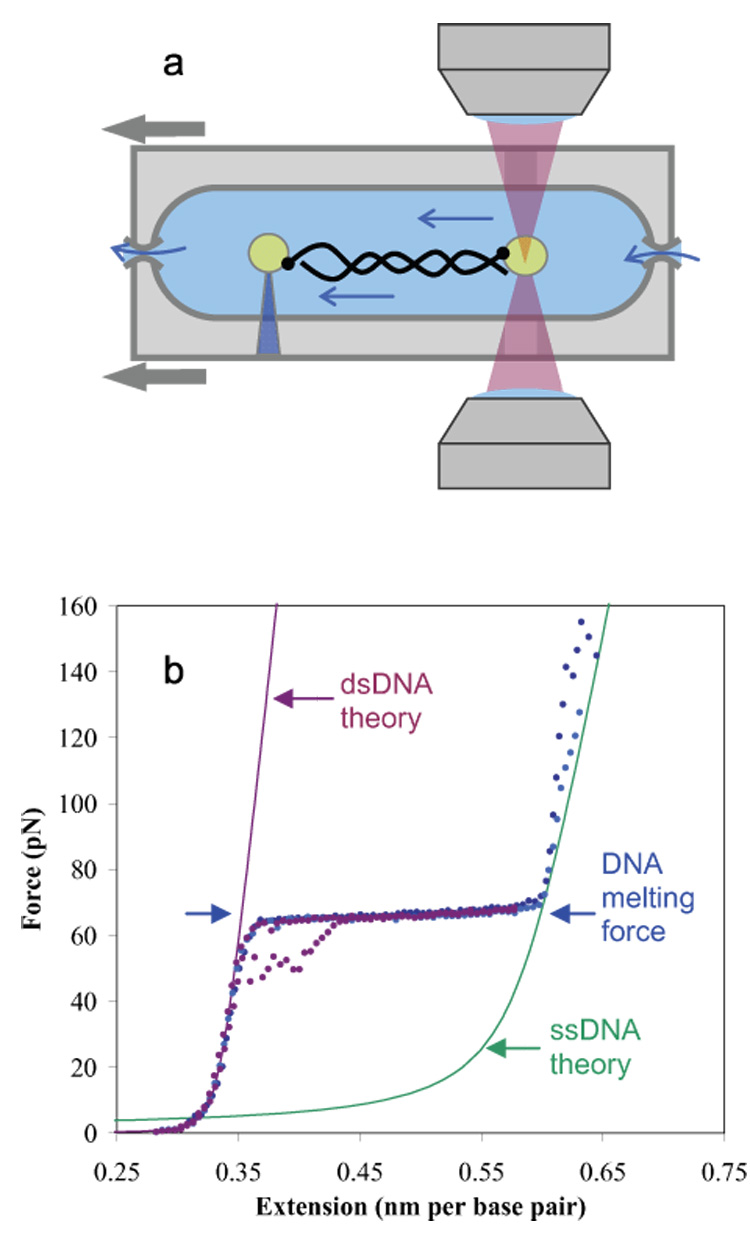
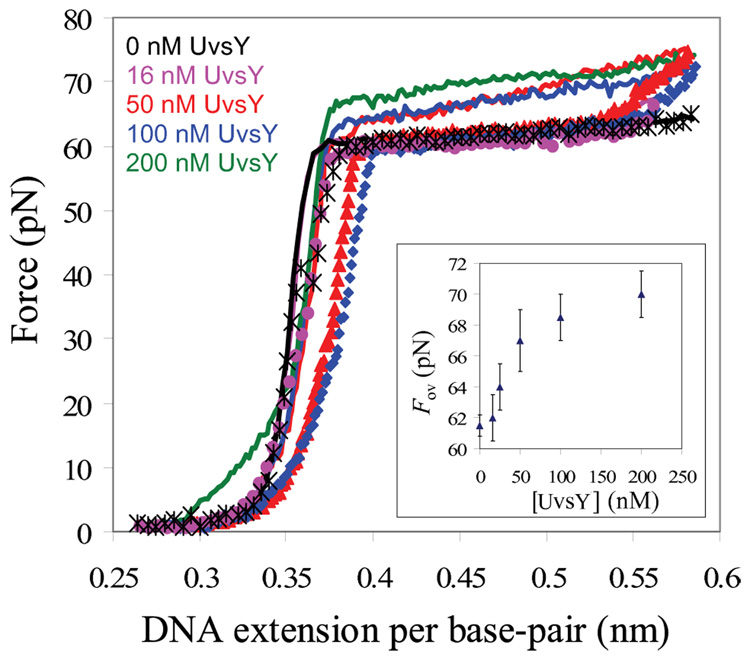
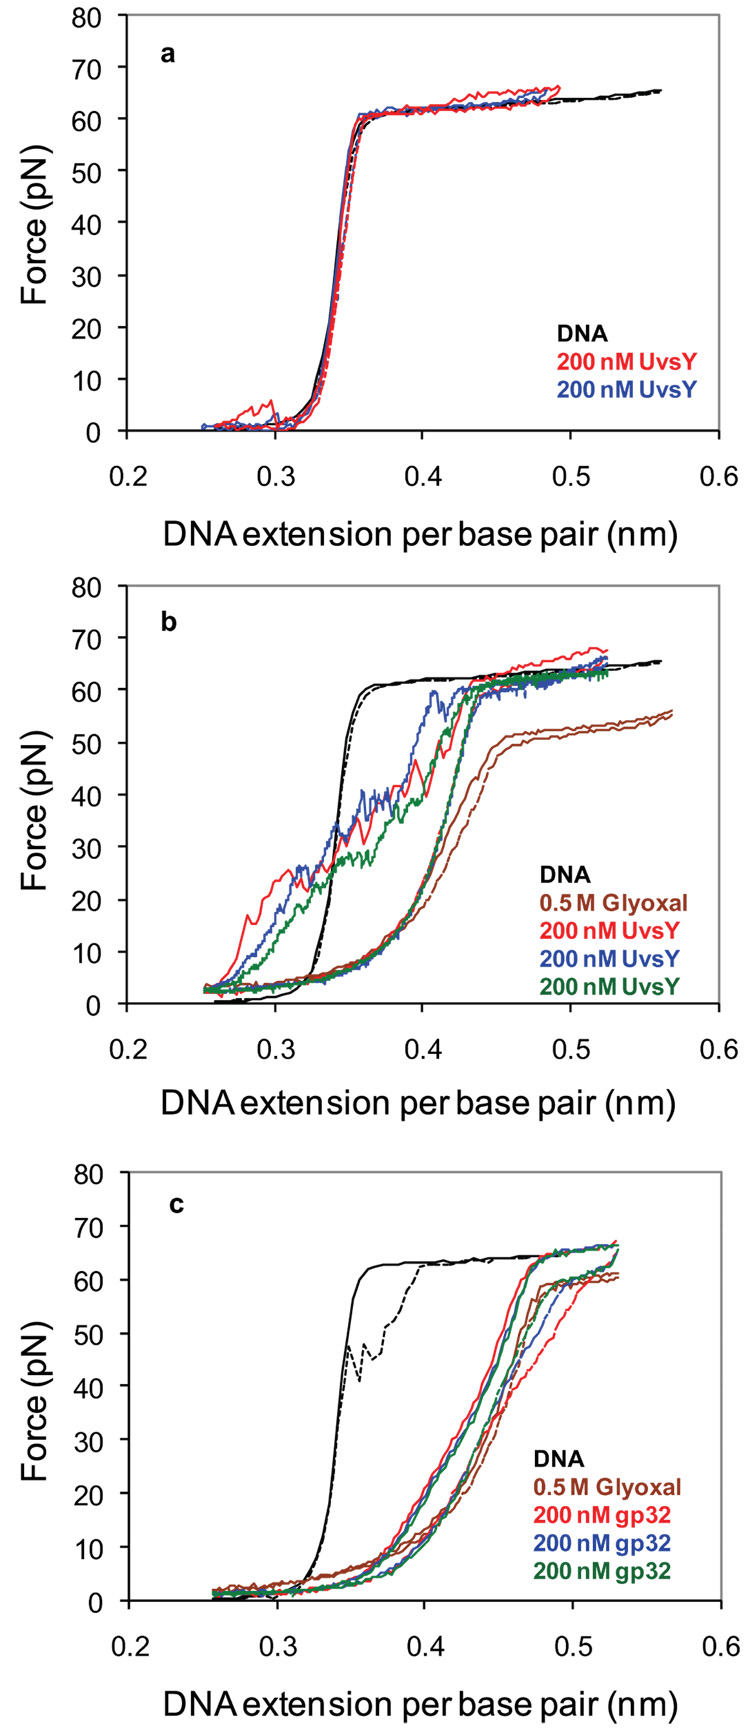
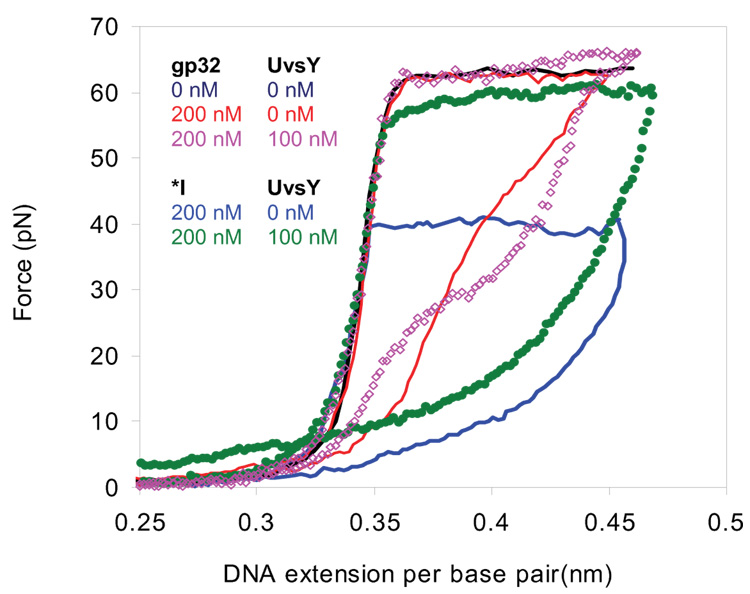
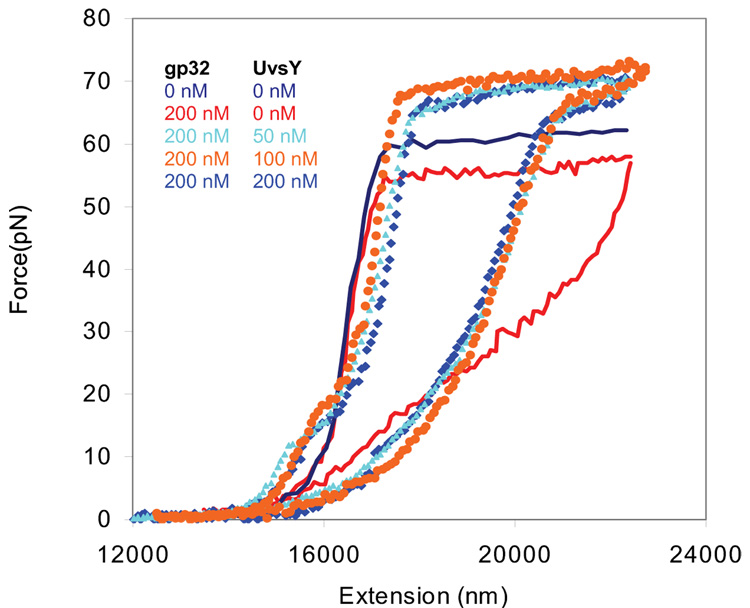
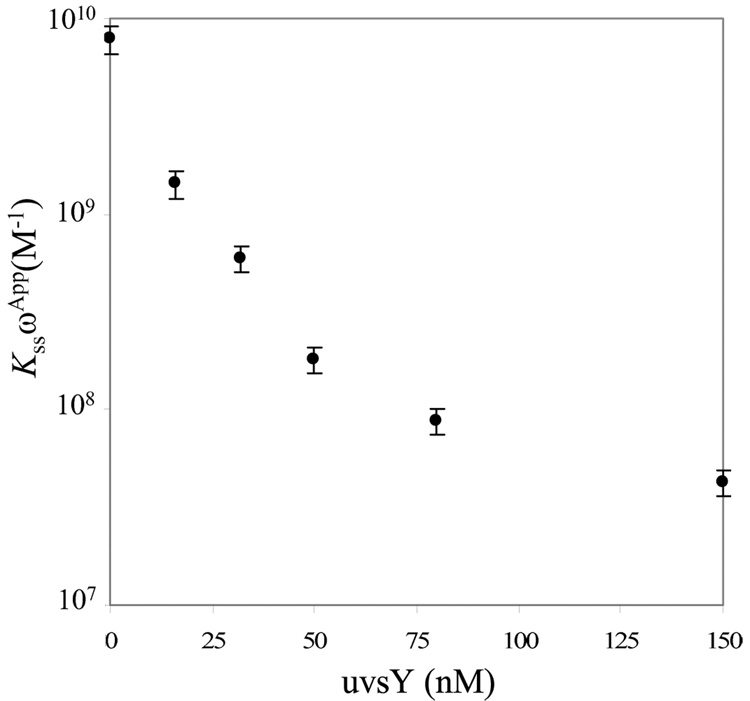
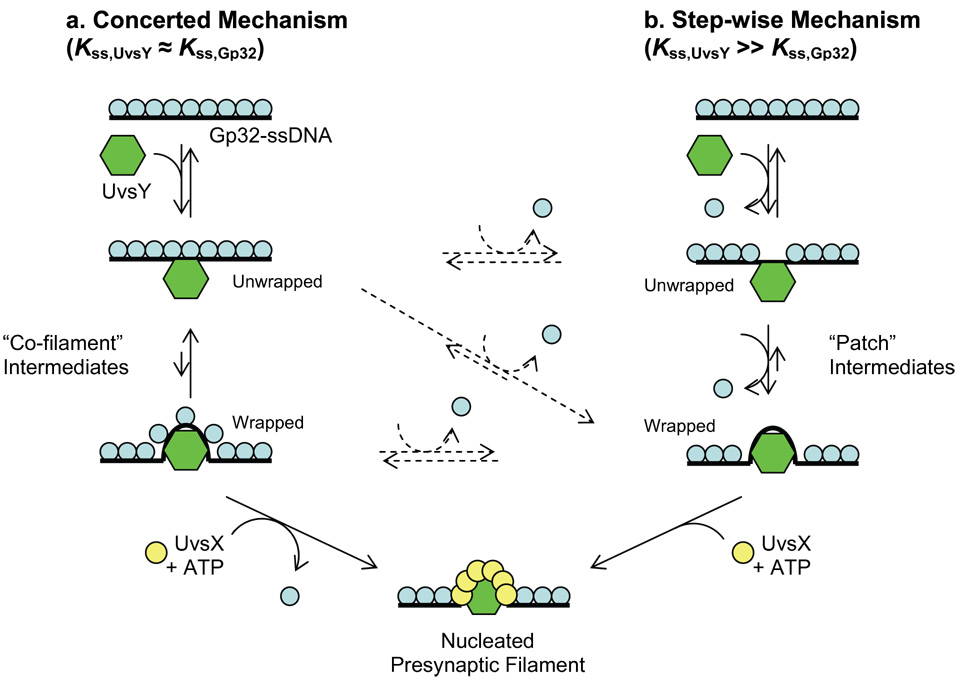
Bacteriophage T4 UvsY is a recombination mediator protein that promotes assembly of the UvsX-ssDNA presynaptic filament. UvsY helps UvsX to displace T4 gene 32 protein (gp32) from ssDNA, a reaction necessary for proper formation of the presynaptic filament. Here we use DNA stretching to examine UvsY interactions with single DNA molecules in the presence and absence of gp32 and a gp32 C-terminal truncation (*I), and show that in both cases UvsY is able to destabilize gp32-ssDNA interactions. In these experiments UvsY binds more strongly to dsDNA than ssDNA due to its inability to wrap ssDNA at high forces. To support this hypothesis, we show that ssDNA created by exposure of stretched DNA to glyoxal is strongly wrapped by UvsY, but wrapping occurs only at low forces. Our results demonstrate that UvsY interacts strongly with stretched DNA in the absence of other proteins. In the presence of gp32 and *I, UvsY is capable of strongly destabilizing gp32-DNA complexes in order to facilitate ssDNA wrapping, which in turn prepares the ssDNA for presynaptic filament assembly in the presence of UvsX. Thus, UvsY mediates UvsX binding to ssDNA by converting rigid gp32-DNA filaments into a structure that can be strongly bound by UvsX.
Figures
Similar articles
-
Dynamics of bacteriophage T4 presynaptic filament assembly from extrinsic fluorescence measurements of Gp32-single-stranded DNA interactions.J Biol Chem. 2006 Sep 8;281(36):26308-19. doi: 10.1074/jbc.M604349200. Epub 2006 Jul 7. J Biol Chem. 2006. PMID: 16829679
-
Mutations in a conserved motif inhibit single-stranded DNA binding and recombination mediator activities of bacteriophage T4 UvsY protein.J Biol Chem. 2004 Feb 13;279(7):6077-86. doi: 10.1074/jbc.M311557200. Epub 2003 Nov 22. J Biol Chem. 2004. PMID: 14634008
-
Biochemical interactions within a ternary complex of the bacteriophage T4 recombination proteins uvsY and gp32 bound to single-stranded DNA.Biochemistry. 1999 Jan 19;38(3):936-44. doi: 10.1021/bi9817055. Biochemistry. 1999. PMID: 9893989
-
Characterization of an amino-terminal fragment of the bacteriophage T4 uvsY recombination protein.Biochimie. 1997 May;79(5):275-85. doi: 10.1016/s0300-9084(97)83515-8. Biochimie. 1997. PMID: 9258436
-
Mediator proteins orchestrate enzyme-ssDNA assembly during T4 recombination-dependent DNA replication and repair.Proc Natl Acad Sci U S A. 2001 Jul 17;98(15):8298-305. doi: 10.1073/pnas.131007498. Proc Natl Acad Sci U S A. 2001. PMID: 11459967 Free PMC article. Review.
Cited by
-
Functional complementation of UvsX and UvsY mutations in the mediation of T4 homologous recombination.Nucleic Acids Res. 2009 Apr;37(7):2336-45. doi: 10.1093/nar/gkp096. Epub 2009 Feb 25. Nucleic Acids Res. 2009. PMID: 19244311 Free PMC article.
-
Human Rad52 binds and wraps single-stranded DNA and mediates annealing via two hRad52-ssDNA complexes.Nucleic Acids Res. 2010 May;38(9):2917-30. doi: 10.1093/nar/gkp1249. Epub 2010 Jan 16. Nucleic Acids Res. 2010. PMID: 20081207 Free PMC article.
-
Biophysical characterization of DNA binding from single molecule force measurements.Phys Life Rev. 2010 Sep;7(3):299-341. doi: 10.1016/j.plrev.2010.06.001. Epub 2010 Jun 4. Phys Life Rev. 2010. PMID: 20576476 Free PMC article. Review.
-
Assembly and dynamics of the bacteriophage T4 homologous recombination machinery.Virol J. 2010 Dec 3;7:357. doi: 10.1186/1743-422X-7-357. Virol J. 2010. PMID: 21129202 Free PMC article. Review.
-
Bacteriophage T4 Escapes CRISPR Attack by Minihomology Recombination and Repair.mBio. 2021 Jun 29;12(3):e0136121. doi: 10.1128/mBio.01361-21. Epub 2021 Jun 22. mBio. 2021. PMID: 34154416 Free PMC article.
References
-
- Kreuzer KN, Morrical SW. Intiation of T4 DNA replication. In: Karam JD, editor. Molecular Biology of Bacteriophage T4. Washigton, DC: ASM Press; 1994. pp. 28–42.
-
- Williams KR, Spicer EK, LoPresti MB, Guggenheimer RA, Chase JW. Limited proteolysis studies on the Escherichia coli single-stranded DNA binding protein. Evidence for a functionally homologous domain in both the Escherichia coli and T4 DNA binding proteins. J. Biol. Chem. 1983;258:3346–3355. - PubMed
-
- Haseltine CA, Kowalczykoski SC. A distinctive single-strand DNA-binding protein from the Archaeon Sulfolobus solfataricus. Mol. Microbiol. 2002;43:1505–1515. - PubMed
-
- Acharya N, Varshney U. Biochemical properties of single-stranded DNA-binding protein from Mycobacterium smegmatis, a fast-growing mycobacterium and its physical and functional interaction with uracil DNA glycosylases. J. Mol. Biol. 2002;318:1251–1264. - PubMed
Publication types
MeSH terms
Substances
Grants and funding
LinkOut - more resources
Full Text Sources
