

Systematic biological prioritization after a genome-wide association study: an application to nicotine dependence
- PMID: 18565990
- PMCID: PMC2610477
- DOI: 10.1093/bioinformatics/btn315
Systematic biological prioritization after a genome-wide association study: an application to nicotine dependence
Abstract
Motivation: A challenging problem after a genome-wide association study (GWAS) is to balance the statistical evidence of genotype-phenotype correlation with a priori evidence of biological relevance.
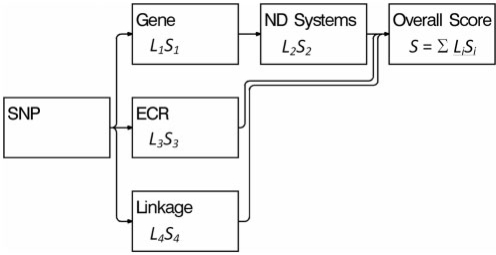
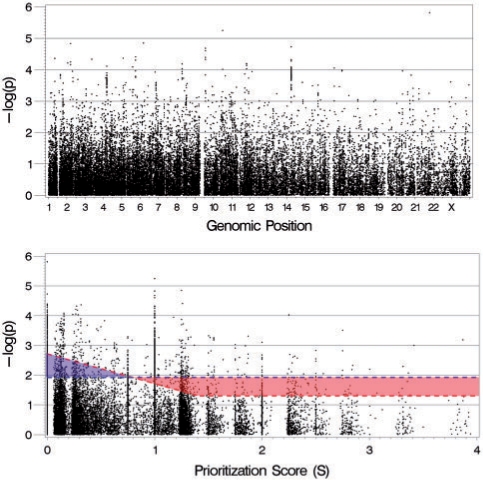
Results: We introduce a method for systematically prioritizing single nucleotide polymorphisms (SNPs) for further study after a GWAS. The method combines evidence across multiple domains including statistical evidence of genotype-phenotype correlation, known pathways in the pathologic development of disease, SNP/gene functional properties, comparative genomics, prior evidence of genetic linkage, and linkage disequilibrium. We apply this method to a GWAS of nicotine dependence, and use simulated data to test it on several commercial SNP microarrays.
Availability: A comprehensive database of biological prioritization scores for all known SNPs is available at http://zork.wustl.edu/gin. This can be used to prioritize nicotine dependence association studies through a straightforward mathematical formula-no special software is necessary.
Supplementary information: Supplementary data are available at Bioinformatics online.
Figures
References
-
- Adie EA, et al. SUSPECTS: enabling fast and effective prioritization of positional candidates. Bioinformatics. 2006;22:773–774. - PubMed
-
- Arakawa K, et al. KEGG-based pathway visualization tool for complex omics data. In Silico Biol. 2005;5:419–423. - PubMed
-
- Barrett JC, et al. Haploview: analysis and visualization of LD and haplotype maps. Bioinformatics. 2005;21:263–265. - PubMed
Publication types
MeSH terms
Grants and funding
- U10AA008401/AA/NIAAA NIH HHS/United States
- N01DA07079/DA/NIDA NIH HHS/United States
- U24MH068457/MH/NIMH NIH HHS/United States
- P01 CA089392/CA/NCI NIH HHS/United States
- U01 HG004422/HG/NHGRI NIH HHS/United States
- R01 DA019963/DA/NIDA NIH HHS/United States
- U24 MH068457/MH/NIMH NIH HHS/United States
- R01DA019963/DA/NIDA NIH HHS/United States
- R56 DA012854/DA/NIDA NIH HHS/United States
- R56DA12854/DA/NIDA NIH HHS/United States
- K01DA015129/DA/NIDA NIH HHS/United States
- P01CA89392/CA/NCI NIH HHS/United States
- K01 DA015129/DA/NIDA NIH HHS/United States
- U01HG004422/HG/NHGRI NIH HHS/United States
- K02DA021237/DA/NIDA NIH HHS/United States
- IRG5801050/PHS HHS/United States
- K02 DA021237/DA/NIDA NIH HHS/United States
- U10 AA008401/AA/NIAAA NIH HHS/United States
- HHSN271200477471C/PHS HHS/United States
LinkOut - more resources
Full Text Sources
Other Literature Sources
Molecular Biology Databases
