. 2008 Aug 15;586(16):3893-915.
doi: 10.1113/jphysiol.2008.155242. Epub 2008 Jun 19.

The presence of pacemaker HCN channels identifies theta rhythmic GABAergic neurons in the medial septum

Affiliations

The presence of pacemaker HCN channels identifies theta rhythmic GABAergic neurons in the medial septum

Viktor Varga et al. J Physiol. .

Abstract

The medial septum (MS) is an indispensable component of the subcortical network which synchronizes the hippocampus at theta frequency during specific stages of information processing. GABAergic neurons exhibiting highly regular firing coupled to the hippocampal theta rhythm are thought to form the core of the MS rhythm-generating network. In recent studies the hyperpolarization-activated, cyclic nucleotide-gated non-selective cation (HCN) channel was shown to participate in theta synchronization of the medial septum. Here, we tested the hypothesis that HCN channel expression correlates with theta modulated firing behaviour of MS neurons by a combined anatomical and electrophysiological approach. HCN-expressing neurons represented a subpopulation of GABAergic cells in the MS partly overlapping with parvalbumin (PV)-containing neurons. Rhythmic firing in the theta frequency range was characteristic of all HCN-expressing neurons. In contrast, only a minority of HCN-negative cells displayed theta related activity. All HCN cells had tight phase coupling to hippocampal theta waves. As a group, PV-expressing HCN neurons had a marked bimodal phase distribution, whereas PV-immunonegative HCN neurons did not show group-level phase preference despite significant individual phase coupling. Microiontophoretic blockade of HCN channels resulted in the reduction of discharge frequency, but theta rhythmic firing was perturbed only in a few cases. Our data imply that HCN-expressing GABAergic neurons provide rhythmic drive in all phases of the hippocampal theta activity. In most MS theta cells rhythm genesis is apparently determined by interactions at the level of the network rather than by the pacemaking property of HCN channels alone.


Figures

Figure 2
Figure 2. Subcellular localization of HCN1 subunits revealed variable intensity of labelling
The electron-dense DAB reaction product resulting from HCN1 immunoreaction can be observed in membranes of somata (A and B), dendrites (C and E) and infrequently in axons (D). The strength of soma labelling was highly variable ranging from strong, which continuously delineates the plasma membrane (A), to weak, patchy labelling indicating the uneven concentration of immunogenic material along the perimeter of the soma (B: arrows indicate few patches) supporting the light microscopic observation of variable expression levels of HCN ion channels on MS neurons. Scales: A and C: 5 μm; B: 2 μm; D and E: 1 μm;
Figure 1
Figure 1. Colocalization of HCN1 immunoreactivity with neurochemical markers
A, double immunolabelling of HCN1 (green) and parvalbumin (red) is shown. The long arrow points to a double-labelled neuron while the short arrow indicates a non-HCN, PV-containing neuron. The filled arrowhead marks a single labelled HCN1-immunoreactive neuron. Note the different intensity of HCN1 labelling: the open arrowhead marks a strongly labelled, while the filled arrowhead points to a weakly stained, HCN1-immunoreactive neuron (see also Fig. 2). B and C represent the result of the GAD67 in situ HCN1 immunocytochemistry double labelling. Free-floating sections were labelled by the GAD67 probe (dark blue reaction product) and HCN1 immunocytochemistry. B, fluorescence photomicrograph presenting a double labelled neuron (note the shading effect of the in situ precipitate); C, the same cell on a light microscopic photomicrograph. DF, retrograde labelling experiment, in which fluorescent microsphere was injected (green) into the hippocampus, and the medial septal sections containing the retrogradely labelled neurons were immunostained for parvalbumin and HCN1. E, a retrogradely labelled septo-hippocampal neuron double-stained for PV (D) as well as HCN1 (F) is shown. G and H, HCN1 and HCN2 stain the same cell population in the medial septum. In these panels representative sections used for examining the colocalization by Kosaka's mirror technique are demonstrated. Arrows point to labelled neurons: in G one half of each cell was stained by HCN1, in H the corresponding other half of the cells was labelled by antibody against HCN2. Arrowheads indicate the presence of oligodendrocytes in the HCN2 staining, since these cells do not express the HCN1 subunit. Scale 10 μm for AF, 20 μm for G and H.
Figure 3
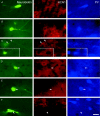
Figure 3. Immunocytochemical identification of HCN-IR and non-HCN neurons presented on Figs 4 and 5
Left column, the neurobiotin-labelled cell body and/or dendrites; middle column, HCN1 immunoreactivity; right column, PV staining. In AC the representative examples of the electrophysiological categories of HCN-IR neurons of Fig. 4 are shown. Cells in panels A and B contain PV besides HCN1. Arrowheads on panel C mark an HCN1-immunoreactive dendritic trunk close to the section surface. In DF three non-HCN cells shown on Fig. 5 are presented. The neuron in panel E was proved to be PV immunoreactive. Arrows point to the somata of HCN1-immunonegative cells. See also the HCN1-immunoreactive elements in the vicinity of the immunonegative neurons. Scale bar in the lowermost right corner = 20 μm.
Figure 4
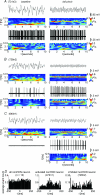
Figure 4. Firing behaviour of HCN-IR neurons
Significant theta rhythmic component characterized all firing pattern types exhibited by HCN-IR neurons. Ten second long segments were selected from baseline (left column) and tail pinch-induced theta periods (right column). Under each raw data trace the corresponding wavelet spectrum (time–frequency decomposition) is shown. Theta band is in the upper half of the wavelet spectra (between 2.5 and 6 Hz). Warmer colours indicate higher magnitude (numbers on the left/right side of colour bars corresponds to the range of magnitudes of wavelet coefficients on left/right wavelet spectra). A demonstrates a representative example of neurons (n = 11, number in brackets is the code of the depicted neuron) firing in theta burst mode not only associated with hippocampal theta but occasionally during non-theta states as well. In the left column an episode of theta bursting can be observed while the hippocampal EEG is dominated by slow, non-theta activity. Note that spike clusters occurred at lower frequency and intercluster interval was more variable than during hippocampal theta-associated bursting (right column). The induction of theta changed the firing pattern of these neurons to more regular with tight phase coupling of bursts to hippocampal theta waves. The neuron in B fired irregularly paced spike clusters or single spikes during baseline segments whereas its activity was rendered to highly regular theta bursting in parallel with the formation of hippocampal theta (n = 13 HCN-IR neurons showed this type of firing behaviour). The only non-bursting HCN-IR neuron presented in C did not produce separable theta bursts despite the occasional theta modulation of its firing pattern (see the warm-coloured spots in the theta band of the lowermost wavelet spectrum in the right column). D, the ripple-associated firing activity of HCN-IR neurons. Peri-event time histograms centred at ripple peaks of all (left, n = 25), an activated (middle) and an inhibited HCN-IR neuron (right) are presented. The lack of a clearly separable peak on the group histogram (left) indicates that the ripple-associated activity change was not a distinguishing characteristic of the HCN-IR neuron group. However, the analysis of individual cells revealed diverse behaviours during ripples. Bin size of peri-event time histograms: 10 ms.
Figure 5
Figure 5. Firing behaviour of non-HCN neurons
The organization of the figure is the same as for Fig. 4. The neuron in A belongs to the most populous non-HCN neuron subgroup (n = 7): these cells fired irregularly during both baseline and theta periods not showing any synchronization with hippocampal theta. B shows one example of the subgroup of non-HCN neurons (n = 4) characterized by irregular spiking during baseline periods and switched to theta bursting in response to tail pinch (similar to the tail pinch responsive subgroup of HCN-IR cells of which one example is shown on Fig. 4B). The neuron presented in C (the only one of this type) exhibited very low baseline activity and was activated by tail pinch. It fired spike clusters phase locked to every second theta wave. As a result, the dominant frequency component in its firing activity had half the frequency of ongoing hippocampal theta (compare the corresponding EEG and unit wavelets in the left column of part C). D, during ripples, the group of non-HCN neurons, similar to HCN-IR cells, did not show a characteristic direction of alteration in activity as can be seen on the left peri-event time histogram representing the firing activity of all non-HCN neurons (n = 12). However, on the level of individual cells both activation – middle histogram – and inhibition – right histogram – were observed. Bin size of peri-event time histograms: 10 ms.
Figure 6
Figure 6. Phase relation of theta bursting neurons of the analysed anatomical groups to hippocampal theta activity
A, the phase histograms of neurons arranged in an ascending order of mean angles and merged into a matrix. Each row corresponds to an individual phase histogram. Two idealized theta cycles (in light purple) were overlaid for reference. Note that PV-containing HCN-IR neurons fire only on the ascending phase of the theta cycle and tend to form groups around the trough and before the peak of the cycle while the HCN-IR/non-PV group covers the entire cycle. B, the cumulative phase histograms of the two major anatomical groups. As demonstrated in A the bimodal distribution of PV/HCN-IR neurons as opposed to the multimodal distribution of HCN/non-PV phase angles is clearly visible. The Y-axis corresponds to firing probability. C, polar plot in which the individual phase preferences and mean vector length (MVL) are plotted for all theta bursting neurons. Larger distance from the centre of the circle means higher mean vector length value corresponding to stronger phase coupling. Note the grouping of PV-IR neurons (both HCN-IR = blue dots and non-HCN = cyan dot) around the trough (180 deg) and before the peak (360 deg) of the theta cycle. In contrast, non-PV/HCN neurons (red dots) are dispersed around the circle not showing a group-level phase preference. The three non-HCN/non-PV neurons (green dots) preferred to fire in regions avoided by the other anatomical groups. Bin size for phase histograms = 10 deg.
Figure 7
Figure 7. The local blockade of HCN channels in the vicinity of an HCN-IR neuron causes robust reduction of firing activity without disrupting theta-modulated discharge
A, fluorescence photomicrographs in which the immunocytochemical identification is demonstrated. As shown, this neuron was proved to express both HCN and PV. B, plot of the firing rate of the neuron during the control and drug injection periods counted in 1 s windows. Note the reduction of firing around the half of the control recording period coincident with the cessation of spontaneous theta in the hippocampus (not shown). The intermittent elevations following tail pinches (yellow bars = 30 s) can also be observed. The application of the HCN blocker ZD7288 (red line) at 5 mm at 40 nA had resulted in a gradual reduction of firing activity falling well below control level which continued after the cessation of ZD ejection. The latter phenomenon could be explained by the well-documented irreversible nature of HCN blockade by ZD (see Results for reference). C, three 5 s long segments are shown separately cut from spontaneous weak (left trace) or tail-pinch-elicited strong theta episodes (middle trace and right trace). The location of the selected segments are marked by * (it should be noted that the width of the asterisks corresponds to ∼5 s). It is clearly visible that the length of theta bursts is decreased due to the reduction in the number of spikes per bursts. Coincidentally, the number of omitted theta cycles was increased resulting in the lengthening of interburst intervals. Note that before the onset of drug ejection the neuron fired in theta burst mode even when theta was weak in the hippocampus (this cell belonged to the constitutively bursting HCN-IR neuron group: see the mixed slow oscillatory/theta-like pattern of the EEG and the highly regular theta bursting of the MS unit on the left trace). It is also clearly visible that hippocampal theta was not affected by ZD microiontophoresis (compare the EEG on the middle and right trace). The robust drop in firing rate with concurrent stability of the bursting pattern is also evident on the autocorrelograms of panel D calculated from the theta episodes sampled for panel C. The lowering of intraburst spike number is proven by the drop in the height of the first peak of the interspike interval histogram of panel E corresponding to intraburst intervals. Panel Fa–c shows the recurrence plots of interspike intervals on which the intra- (next to the origo) and interburst intervals (further along the two axes) are clearly separated. The fourth cluster of intervals represents single spikes occurring outside theta bursts. Note that the proportion of the latter relative to intraburst intervals increased during drug ejection indicating that theta bursts were replaced partly by single spikes. G, the phase relationship of firing to the ongoing theta was shifted (mean angles above columns), but the strength of phase preference did not change consistently (MVL: mean vector length on left axis, and grey columns) despite the significant drop of firing activity (F: firing rate on right axis and black line plot). Horizontal bar below raw traces = 1 s, vertical bar = 2 mV for unit and 0.7 mV for EEG. Bin size for autocorrelogram = 10 ms; for ISIH plots = 1 ms.

References

    1. Alonso A, Gaztelu JM, Buno W, Jr, Garcia-Austt E. Cross-correlation analysis of septohippocampal neurons during theta rhythm. Brain Res. 1987;413:135–146. - PubMed
    1. Alreja M. Excitatory actions of serotonin on GABAergic neurons of the medial septum and diagonal band of Broca. Synapse. 1996;22:15–27. - PubMed
    1. Alreja M, Shanabrough M, Liu W, Leranth C. Opioids suppress IPSCs in neurons of the rat medial septum/diagonal band of Broca: involvement of μ-opioid receptors and septohippocampal GABAergic neurons. J Neurosci. 2000a;20:1179–1189. - PMC - PubMed
    1. Alreja M, Wu M, Liu W, Atkins JB, Leranth C, Shanabrough M. Muscarinic tone sustains impulse flow in the septohippocampal GABA but not cholinergic pathway: implications for learning and memory. J Neurosci. 2000b;20:8103–8110. - PMC - PubMed
    1. Barrenechea C, Pedemonte M, Nunez A, Garcia-Austt E. In vivo intracellular recordings of medial septal and diagonal band of Broca neurons: relationships with theta rhythm. Exp Brain Res. 1995;103:31–40. - PubMed

Publication types

MeSH terms

Substances