

Alzheimer disease: postmortem neuropathologic correlates of antemortem 1H MR spectroscopy metabolite measurements
- PMID: 18566174
- PMCID: PMC2735577
- DOI: 10.1148/radiol.2481071590
Alzheimer disease: postmortem neuropathologic correlates of antemortem 1H MR spectroscopy metabolite measurements
Abstract
Purpose: To determine the neuropathologic correlates of antemortem hydrogen 1 ((1)H) magnetic resonance (MR) spectroscopy metabolite measurements in subjects with Alzheimer disease (AD)-type pathology.
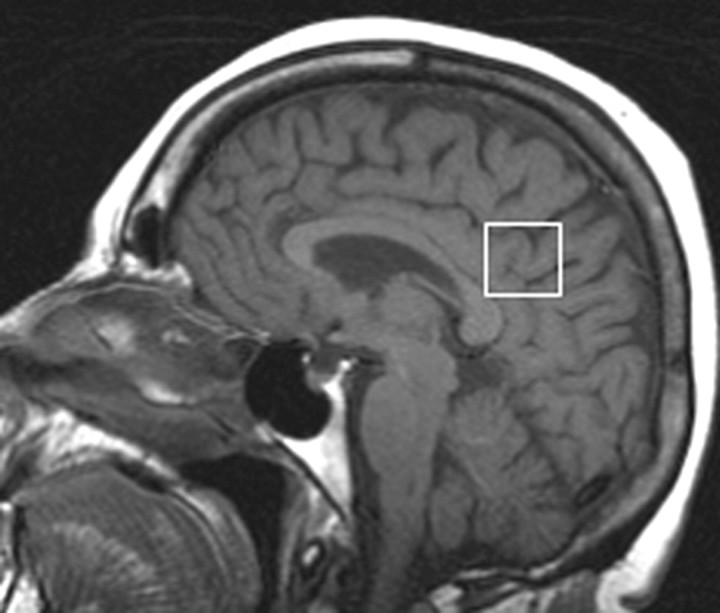
Materials and methods: This study was approved by the institutional review board and was compliant with HIPAA regulations. Informed consent was obtained from each subject. The authors identified 54 subjects who underwent antemortem (1)H MR spectroscopy and were clinically healthy or had AD-type pathology with low to high likelihood of AD according to National Institute on Aging-Reagan neuropathologic criteria at autopsy. They investigated the associations between (1)H MR spectroscopy metabolite measurements and Braak neurofibrillary tangle stage (Braak stage), neuritic plaque score, and AD likelihood, with adjustments for subject age, subject sex, and time between (1)H MR spectroscopy and death.
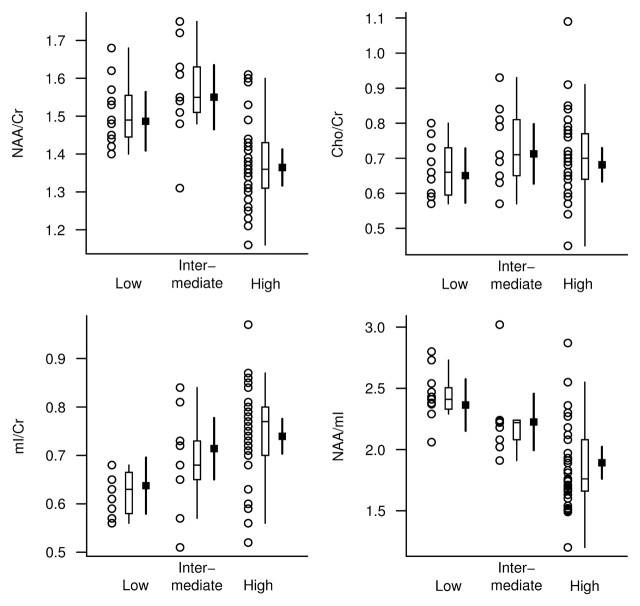
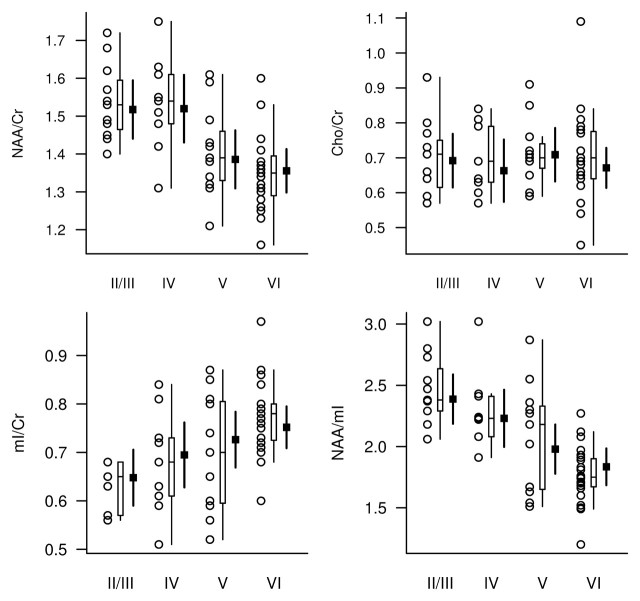
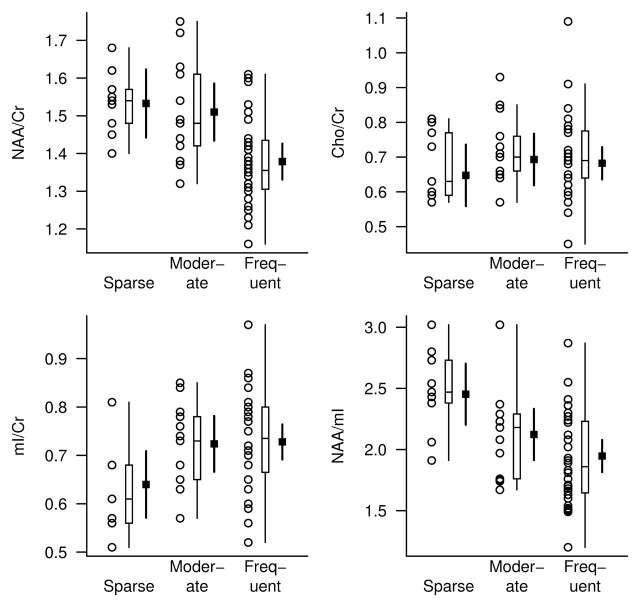
Results: Decreases in N-acetylaspartate-to-creatine ratio, an index of neuronal integrity, and increases in myo-inositol-to-creatine ratio were associated with higher Braak stage, higher neuritic plaque score, and greater likelihood of AD. The N-acetylaspartate-to-myo-inositol ratio proved to be the strongest predictor of the pathologic likelihood of AD. The strongest association observed was that between N-acetylaspartate-to-myo-inositol ratio and Braak stage (R(N)(2) = 0.47, P < .001).
Conclusion: Antemortem (1)H MR spectroscopy metabolite changes correlated with AD-type pathology seen at autopsy. The study findings validated (1)H MR spectroscopy metabolite measurements against the neuropathologic criteria for AD, and when combined with prior longitudinal (1)H MR spectroscopy findings, indicate that these measurements could be used as biomarkers for disease progression in clinical trials.
(c) RSNA, 2008.
Figures
References
-
- Growdon JH Biomarkers of Alzheimer disease. Arch Neurol 1999;56:281–283. - PubMed
-
- Kantarci K, Jack CR Jr. Neuroimaging in Alzheimer disease: an evidence-based review. Neuroimaging Clin N Am 2003;13:197–209. - PubMed
-
- Klunk WE, Panchalingam K, Moossy J, McClure RJ, Pettegrew JW. N-acetyl-L-aspartate and other amino acid metabolites in Alzheimer's disease brain: a preliminary proton nuclear magnetic resonance study. Neurology 1992;42:1578–1585. - PubMed
-
- Miller BL, Moats RA, Shonk T, Ernst T, Woolley S, Ross BD. Alzheimer disease: depiction of increased cerebral myo-inositol with proton MR spectroscopy. Radiology 1993;187:433–437. - PubMed
Publication types
MeSH terms
Substances
Grants and funding
LinkOut - more resources
Full Text Sources
Medical
