. 2008 Jul 1;181(1):449-63.
doi: 10.4049/jimmunol.181.1.449.

Activation of the JAK/STAT-1 signaling pathway by IFN-gamma can down-regulate functional expression of the MHC class I-related neonatal Fc receptor for IgG

Affiliations

Activation of the JAK/STAT-1 signaling pathway by IFN-gamma can down-regulate functional expression of the MHC class I-related neonatal Fc receptor for IgG

Xindong Liu et al. J Immunol. .

Abstract

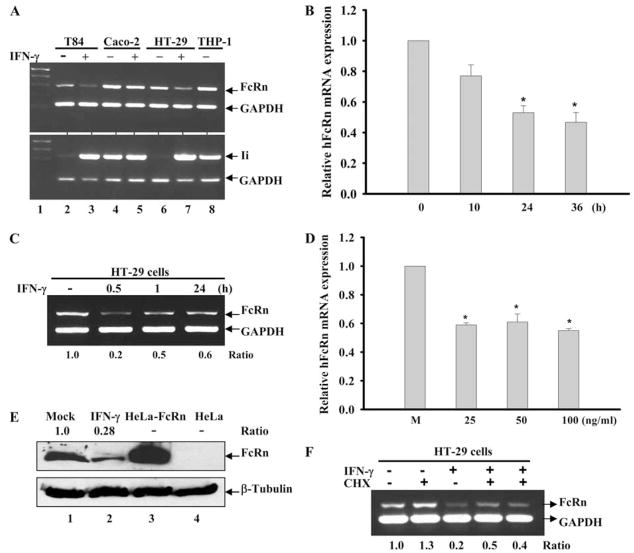
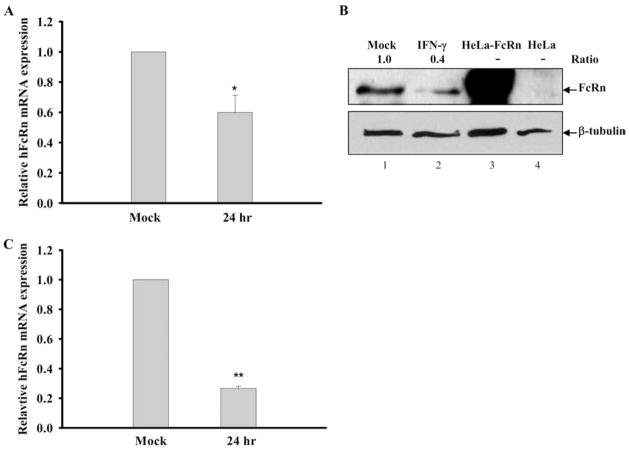
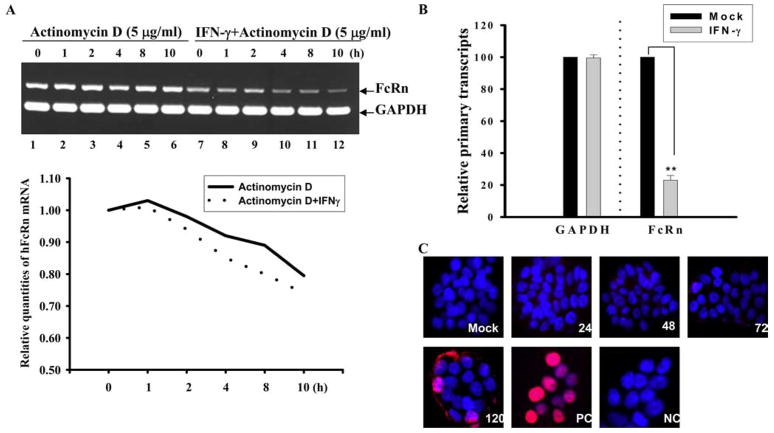
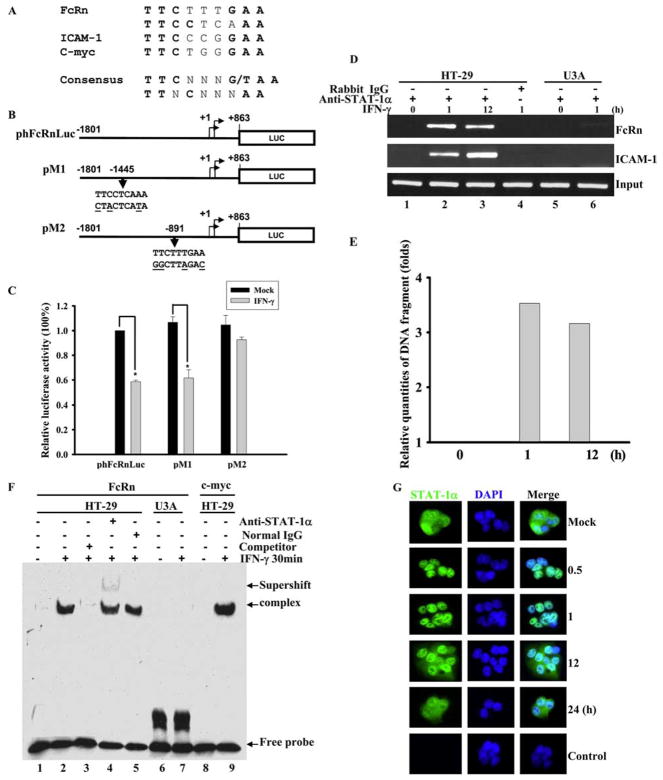
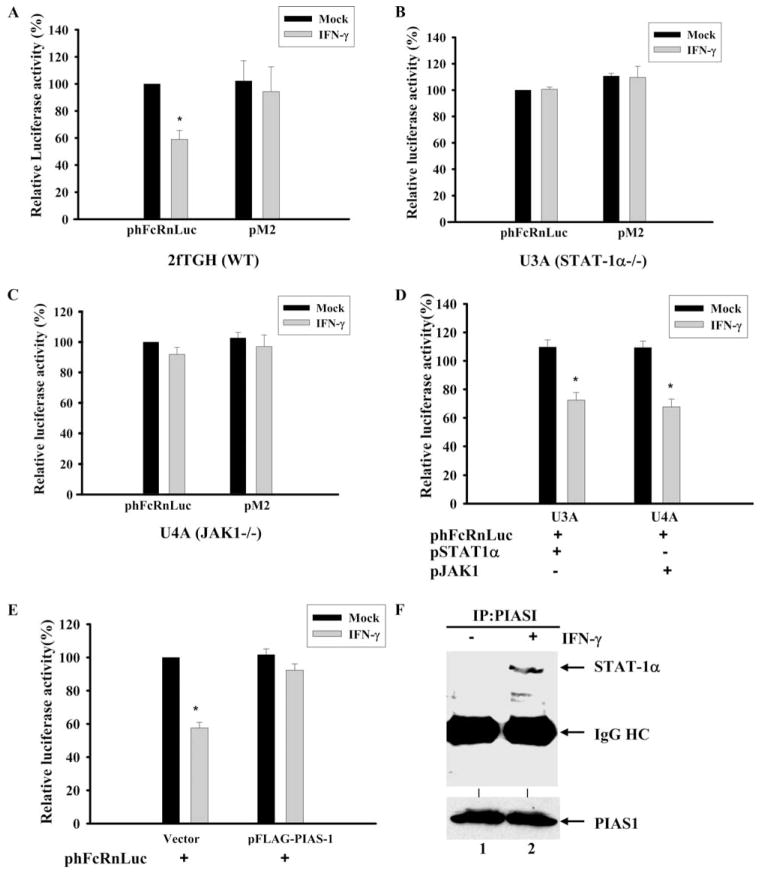
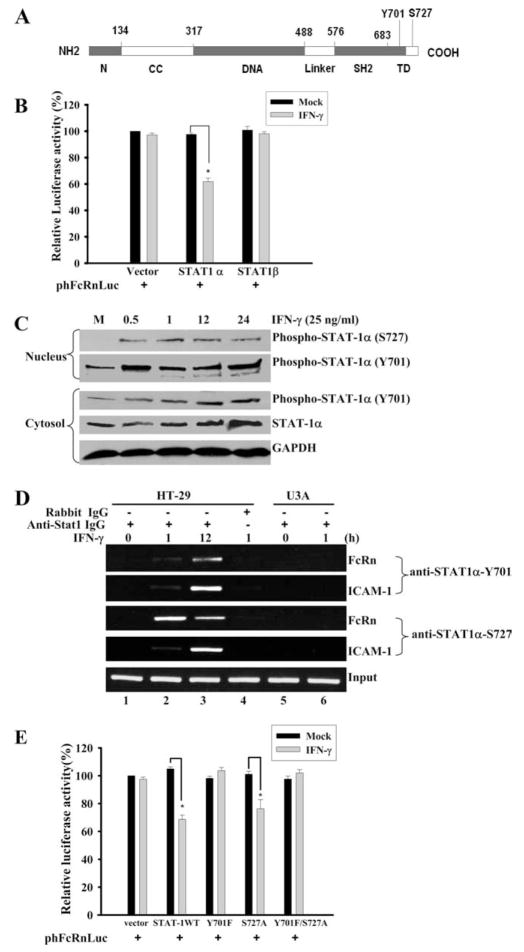
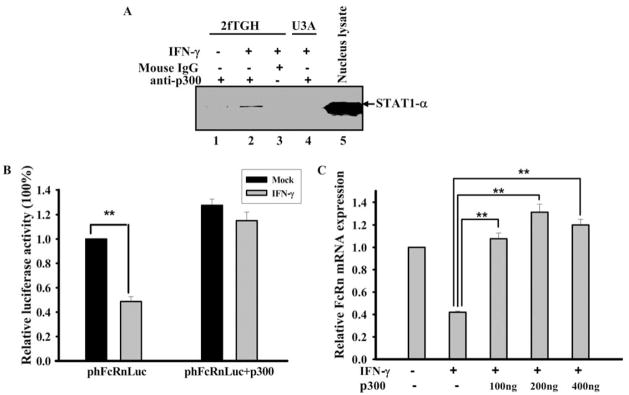
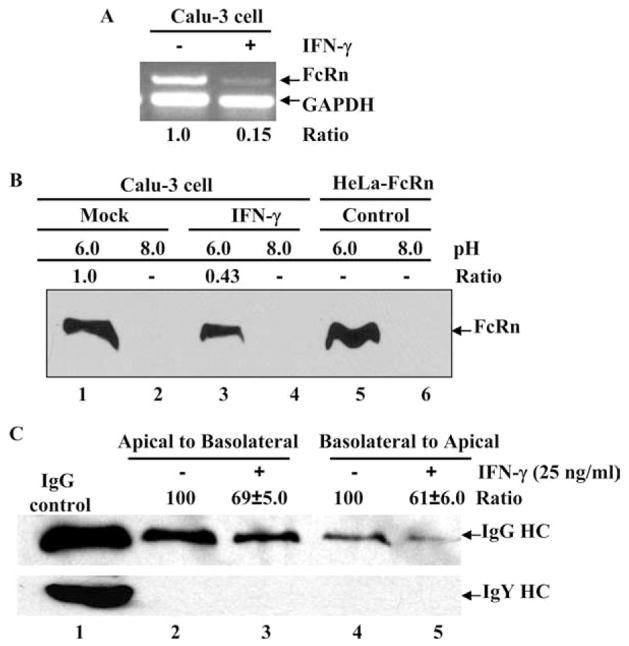
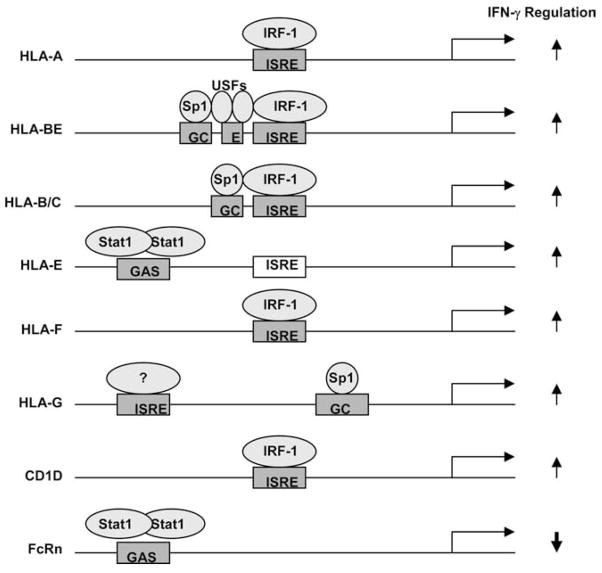
Expression of many MHC genes is enhanced at the transcriptional or posttranscriptional level following exposure to the cytokine IFN-gamma. However, in this study we found that IFN-gamma down-regulated the constitutive expression of the neonatal Fc receptor (FcRn), an MHC class I-related molecule that functions to transport maternal IgG and protect IgG and albumin from degradation. Epithelial cell, macrophage-like THP-1 cell, and freshly isolated human PBMC exposure to IFN-gamma resulted in a significant decrease of FcRn expression as assessed by real-time RT-PCR and Western blotting. The down-regulation of FcRn was not caused by apoptosis or the instability of FcRn mRNA. Chromatin immunoprecipitation and gel mobility shift assays showed that STAT-1 bound to an IFN-gamma activation site in the human FcRn promoter region. Luciferase expression from an FcRn promoter-luciferase reporter gene construct was not altered in JAK1- and STAT-1-deficient cells following exposure to IFN-gamma, whereas expression of JAK1 or STAT-1 protein restored the IFN-gamma inhibitory effect on luciferase activity. The repressive effect of IFN-gamma on the FcRn promoter was selectively reversed or blocked by mutations of the core nucleotides in the IFN-gamma activation site sequence and by overexpression of the STAT-1 inhibitor PIAS1 or the dominant negative phospho-STAT-1 mutations at Tyr-701 and/or Ser-727 residues. Furthermore, STAT-1 might down-regulate FcRn transcription through sequestering the transcriptional coactivator CREB binding protein/p300. Functionally, IFN-gamma stimulation dampened bidirectional transport of IgG across a polarized Calu-3 lung epithelial monolayer. Taken together, our results indicate that the JAK/STAT-1 signaling pathway was necessary and sufficient to mediate the down-regulation of FcRn gene expression by IFN-gamma.


Figures

FIGURE 1
FIGURE 1
Down-regulation of human FcRn expression in epithelial cells by IFN-γ. *, p < 0.05. A, Down-regulation of human FcRn and up-regulation of Ii occur concomitantly in response to IFN-γ treatment. Human intestinal cell lines were treated with (+) IFN-γ (lanes 3, 5, and 7) or without (−) IFN-γ (lanes 2, 4, and 6) (50 ng/ml) for 48 h. Total RNA was isolated by TRIzol reagent and analyzed by semiquantitative RT-PCR for FcRn and Ii mRNA. RNA from THP-1 cells was used as a positive control for Ii amplification (lane 8). GAPDH amplification was used as an internal control. B, Time course effects of IFN-γ on FcRn expression. Quantitative real-time RT-PCR analysis of human FcRn mRNA in HT-29 cells treated with IFN-γ (25 ng/ml) for 10, 24, and 36 h or left untreated. C, IFN-γ incubation time and FcRn expression. Human intestinal HT-29 cells were incubated with or without IFN-γ (25 ng/ml) for 0.5, 1, and 24 h. At the end of the shorter incubation periods, HT-29 cells were washed at least six times and then incubated in fresh medium to reach 24 h. Total RNA was isolated and analyzed by semiquantitative RT-PCR for FcRn and GAPDH. D, Dose-response effects of IFN-γ on FcRn expression. Human intestinal HT-29 cells were treated without (M) or with IFN-γ at the indicated dosages for 24 h. FcRn mRNA was analyzed by quantitative real-time RT-PCR analysis. E, Western blot analysis of FcRn expression. The cell lysates (20 μg) from mock-treated (lane 1) and IFN-γ-stimulated HT-29 (lane 2) were separated by electrophoresis in a 12% SDS-polyacrylamide gel and transferred to a nitrocellulose membrane. Cell lysates from HeLa-FcRn (lane 3) and HeLa (lane 4) were used as positive or negative controls, respectively. Proteins were blotted with affinity-purified rabbit anti-FcRn- (top panel) or β-tubulin-specific Ab (bottom panel) and then incubated with HRP-conjugated anti-IgG Ab. The results were visualized with the ECL method. The ratio of the mock group is assigned a value of 1.0, and the values from other groups are normalized to this value. The ratios of FcRn and β-tubulin are shown as indicated. F, Effects of CHX on IFN-γ-mediated repression of FcRn expression. Human intestinal HT-29 cells were incubated with (+) or without (−) the protein synthesis inhibitor CHX (25 μg/ml) for 2 h as indicated. HT-29 cells were subsequently stimulated with (+) or without (−) IFN-γ (25 ng/ml) for 24 h. At the end of the incubation period, total RNA was isolated and analyzed by RT-PCR for FcRn and GAPDH.
FIGURE 2
FIGURE 2
Down-regulation of human FcRn expression in THP-1 cells and human PBMCs by IFN-γ. A and C, Effect of IFN-γ treatment on FcRn mRNA expression in THP-1 and PBMCs. The macrophage-like THP-1 cells (A) or freshly isolated human PBMCs (C) were treated with or without IFN-γ (25 ng/ml) for 24 h. The levels of FcRn mRNA were measured by quantitative real-time RT-PCR analysis as described in Materials and Methods. Data are mean ± SD of three independent experiments. *, p < 0.05; **, p < 0.01. B, Western blot analysis of FcRn expression in THP-1. The cell lysates (20 μg) from THP-1 (lane 1), IFN-stimulated THP-1 (lane 2), HeLa-FcRn (lane 3), and HeLa (lane 4) were subjected to 12% SDS-polyacrylamide gel electrophoresis. The proteins were transferred to nitrocellulose membrane and blotted with FcRn- (top panel) or β-tubulin-specific Ab (bottom panel). Blots were then incubated with anti-IgG-HRP and visualized with the ECL method. The ratio of the mock was assigned a value of 1.0, and the values from other groups were normalized to this value. The ratios of FcRn- and β-tubulin are shown above the lanes.
FIGURE 3
FIGURE 3
Kinetic studies of FcRn mRNA levels and apoptosis in the absence or presence of IFN-γ. A and B, Kinetic studies of FcRn mRNA levels in the absence or presence of IFN-γ. Human intestinal HT-29 cells were preincubated for 24 h in the absence or presence of IFN-γ (25 ng/ml). Actinomycin D (5 μg/ml) was then added; total cellular RNA was harvested at the indicated time points (1–10 h). Ten nanograms of total RNA were reverse transcribed to cDNA in a final volume of 20 μl. Subsequently, 30 cycles of semiquantitative RT-PCR (A, top panel) or a real-time RT-PCR (A, bottom panel) were performed. Electrophoresis of 10 μl of PCR product was done on 1.5% agarose gel (top panel). FcRn values were normalized for GAPDH with each sample. FcRn product at time 0 before the addition of actinomycin D was plotted as 100% (A, bottom panel). The normalized FcRn mRNA levels are presented in arbitrary units. Solid and dashed lines represent RNA samples isolated from cells cultured in the presence and absence of IFN-γ, respectively. Results are mean of three experiments. B, Nuclear run-on analysis was performed on THP-1 nuclei isolated in the presence of biotin-16-UTP for 30 min. Biotinylated RNA was collected using streptavidin magnetic beads, and the level of FcRn or GAPDH RNA was determined by quantitative real-time RT-PCR. Data are mean ± SD of three independent experiments. **, p < 0.01. C, TUNEL staining of human intestinal epithelial HT-29 cells. After mock treatment or IFN-γ (50 ng/ml) treatment at the indicated times, in situ detection of apoptotic cells was performed on HT-29 cells cultured on coverslips by using an in situ cell death detection kit. Normal human HT-29 cells were stained after treatment with DNase I as a positive control (PC) or stained without terminal deoxynucleotide transferase as a negative control (NC). For the correlation of TUNEL with nuclear morphology, cultures were counterstained with DAPI (5 μg/ml). Red represents apoptosis positive cells. Images were viewed by fluorescence microscopy with excitation at 320 –580 nm.
FIGURE 4
FIGURE 4
Identification of IFN-γ responsive element in human FcRn promoter. A and B, The putative STAT-1 binding sequences in FcRn gene promoter. A, STAT-1 binding sequences in the promoter of ICAM1 and c-myc were used as a positive control. The consensus STAT-1 sequence is in boldface. N represents any nucleotide. B, A schematic representation of the luciferase reporter constructs. The positions of the base count are shown (GenBank accession no. AC010619). Reporter construct phFcRnLuc contains the FcRn promoter sequence from −1801 to +863 kb. The putative GAS mutations (underlined bases) in constructs pM1 and pM2 are also shown. Arrowheads indicate the position of the STAT-1 binding site in relation to the transcription start site of the FcRn gene. Luc, Luciferase. C, Identification of GAS sequence in response to IFN-γ stimulation. Wild-type 2fTGH cells were transiently transfected with phFcRnLuc, pM1, and pM2 constructs. Twenty-four hours after transfection, cells were either mock-treated (filled bar) or treated with IFN-γ (open bar) for 4 h. Cells were then harvested and protein extracts were prepared for the luciferase assay as described in Materials and Methods. Luciferase activity was measured and normalized to Renilla luciferase content. The results show the mean value from three independent experiments. *, p < 0.05. D and E, Detection of the in vivo binding of STAT-1 protein to the human FcRn promoter in a ChIP assay. D, Formaldehyde-crosslinked chromatin was prepared from both mock-treated and IFN-γ-treated HT-29 (lanes 1– 4) or STAT-1-null U3A (lanes 5 and 6) cells as described in Materials and Methods. ChIP assays were performed using STAT-1-specific Abs (lanes 1–3, 5, and 6) or isotype-matched IgG (lane 4) as a negative control. Immunoprecipitated chromatin was subjected to PCR analysis using FcRn and ICAM-1 specific primers. The equivalent amount of chromatin in the immunoprecipitations was monitored by PCR amplification of input chromatin as an internal control. ChIP assay was performed at least three times. E, Quantitative real-time RT-PCR analysis of chromatin immunoprecipitated PCR products for FcRn at the indicated times. F, EMSA analysis of binding activities of DNA probe with nuclear extracts from HT-29 cells treated with (+) or without (−) IFN-γ. DNA binding was performed using a DNA probe of human FcRn promoter with nuclear extracts from HT-29 or U3A cells treated with or without IFN-γ (25 ng/ml) for 30 min. A 26-bp fragment spanning the putative STAT-1 binding sequence corresponding to the GAS was used as a biotin-labeled probe. Binding specificity of these complexes was examined by competition assays with a 100-fold molar excess of unlabeled STAT-1-specific probe (lane 3). Supershift experiments were performed in the presence of the STAT-1 Ab, resulting in the formation of a slow migrating supershift band (lane 4). Free-labeled probes are also indicated. G, Immunofluorescence images of STAT-1 cellular localization at the indicated times after exposure to IFN-γ (25 ng/ml). HT-29 cells stimulated with IFN-γ were stained with Alexa Fluor 458-labeled-STAT-1-specific Ab, and translocation of STAT-1 into the nucleus was detected by immunofluorescence microscopy as described in Materials and Methods. For correlation of the STAT-1 protein (green) with nuclear morphology, cell nuclei were counterstained with DAPI (blue). The images were merged as indicated. STAT-1 is in green, nucleus is in blue, and colocalization is gray/blue.
FIGURE 5
FIGURE 5
Down-regulation of FcRn expression by IFN-γ is dependent on JAK1 and STAT-1 expression. A–C, Wild-type (WT) 2fTGH (A), STAT-1-null U3A (B), and JAK1-null U4A (C) cells were transiently transfected with phFcRnLuc or pM2 construct. D, STAT-1-null U3A or JAK1-null U4A cells were transiently transfected by phFcRnLuc along with pSTAT-1 or pJAK1 constructs. E, The 2fTGH cells were transiently transfected with phFcRnLuc together with vector backbone or pFLAG-PIAS1. Twenty-four hours after transfection, all groups of cells were either mock-treated or treated with IFN-γ for 24 h. Cells were then harvested and protein extracts were prepared for the luciferase assay. Transcriptional activity was measured as firefly luciferase activity and normalized to Renilla luciferase activity. The results show the mean value from three independent experiments. *, p < 0.05. F, Interaction of PIAS1 and STAT-1 proteins. Cell lysates from mock- (lane 1) or IFN-γ-treated (lane 2) 2fTGH cells were immunoprecipitated (IP) with anti-FLAG mAb, and immunoprecipitates were subjected to electrophoresis on a 12% SDS-polyacrylamide gel under reducing conditions and transferred to a nitrocellulose membrane for Western blotting with anti-STAT-1 Ab. Immunoblots were developed with ECL. Experiment was at least performed two times. The cell lysates (bottom row) were blotted to monitor the expression of PIAS1. HC, Heavy chain.
FIGURE 6
FIGURE 6
Differential effects of STAT-1 phosphorylations on IFN-γ-mediated suppression of FcRn gene transcription. A, Schematic diagram of functional domains of STAT-1 protein. N, N-terminal domain; CC, coiled-coil domain; DNA, DNA-binding domain; SH2, Src homology 2 domain; and TD, transactivation domain. Numbers represent the position or length of amino acid in each domain. Y701, Tyrosine 701; S727, serine 727. B, Effects of expression of STAT-1β on FcRn promoter activity. The FcRn promoter construct (0.5 μg) was transiently transfected into U3A cells with empty expression vector pcDNA3 (Vector) and the pSTAT-1α (STAT1 α) and pSTAT-1β (STAT1β) expression vectors (0.5 μg). Twenty-four hours later, transfected cells were treated with or without IFN-γ for 24 h. Cells were then harvested and protein extracts were prepared for the luciferase assay. Transcriptional activity was measured as firefly luciferase activity and normalized to Renilla luciferase activity. *, p < 0.05. C, Dynamic analysis of STAT-1 phosphorylations after IFN-γ stimulation. The 2fTGH cells were treated as indicated above the blot and protein extracts from the nucleus (upper panels) and cytosol (lower panels) were separated by electrophoresis in a 12% SDS-polyacrylamide gel and transferred to a nitrocellulose membrane. The proteins were blotted with anti-phospho-STAT-1 or anti-STAT-1 Abs, respectively. GAPDH was used as an internal control. Blots are representative of three experiments. M, Mock treated. D, Detection of the in vivo binding of phospho-STAT-1 protein to human FcRn promoter. Formaldehyde-crosslinked chromatin was prepared from both mock-treated and IFN-γ-treated 2fTGH (lanes 1– 4) or STAT-1-null U3A (lanes 5 and 6) cells as described in Materials and Methods. ChIP assays were performed using STAT-1-specific (lanes 1–3, 5, and 6) or isotype-matched (lane 4) Abs as a negative control. Immunoprecipitated chromatin was subjected to PCR analysis using FcRn- or ICAM-1-specific primers. The equivalent amount of chromatin in the immunoprecipitations was monitored by PCR amplification of input chromatin as an internal control. ChIP assay was performed at least three times. E, Effects of over-expression of phospho-mutant STAT-1 on FcRn promoter activity. The FcRn promoter construct (0.5 μg) was transiently transfected into U3A cells with the empty expression vector pcDNA3 and the pSTAT-1, pSTAT-1Y701F, pSTAT-1S727A, and pSTAT-1Y701F/S727A expression vectors (0.5 μg). Twenty-four hours later, transfected cells were treated with or without IFN-γ for 24 h. Cells were then harvested and protein extracts were prepared for the luciferase assay. Transcriptional activity was measured as firefly luciferase activity and normalized to Renilla luciferase activity. *, p < 0.05.
FIGURE 7
FIGURE 7
IFN-γ induces the in vivo association of p300 and STAT-1α, and overexpression of p300 blocks IFN-γ-mediated FcRn gene down-regulation. A, The 2fTGH (lanes 1–3) and U3A (lane 4) cells were treated with IFN-γ (10 ng/ml) or mock treated for 2 h and then nuclear extracts were obtained and subjected to immunoprecipitation. Anti-p300 mAb (lanes 1, 2, and 4) and isotype-matched IgG (lane 3) were used to immunoprecipitate the STAT-1α and p300 complex. The immune complexes were separated by electrophoresis in a 12% SDS-polyacrylamide gel and transferred to a nitrocellulose membrane. The proteins were blotted with anti-STAT-1α Ab. Immunoblots were developed with ECL. Nuclear extracts (lane 5) were used as a positive control for blotting. B, The 2fTGH cells were transiently transfected with the FcRn promoter construct phFcRnLuc (1 μg), without and with a p300 construct (1 μg), and the total amount of transfected DNA was normalized by pcDNA3. Transfected cells were treated with IFN-γ or mock treated for 12 h. Cells were then harvested 24 h later. Transcriptional activity was determined as firefly luciferase activity and normalized to Renilla luciferase activity. **, p < 0.01. C, HT-29 cells were transiently transfected with increasing amounts (0.1– 0.4 μg) of a p300 construct, and the total amount of transfected DNA was normalized by pcDNA3. Transfected cells were treated with IFN-γ or mock treated for 14 h. FcRn mRNA was analyzed by quantitative real-time RT-PCR analysis. **, p < 0.01.
FIGURE 8
FIGURE 8
Effects of IFN-γ stimulation on the IgG transcytosis. A, Semiquantitative RT-PCR analysis of FcRn mRNA in the human lung epithelial Calu-3 cell line. The Calu-3 cells were treated (+) with IFN-γ (25 ng/ml) (right lane) or left untreated (−) (left lane) for 24 h. Data are representative results for RT-PCR analysis of FcRn expression in Calu-3. Ratios of FcRn-GAPDH are shown as indicated. B, The pH-dependent FcRn binding of IgG. The Calu-3 cells were lysed in sodium phosphate buffer (pH 6.0 or 8.0) with 0.5% CHAPS. Approximately 1 mg of soluble proteins was incubated with human IgG-Sepharose at 4°C. The eluted proteins were subjected to 12% SDS-polyacrylamide electrophoresis and subjected to Western blot analysis. Proteins were probed with affinity-purified rabbit anti-FcRn peptide Ab and HRP-conjugated donkey anti-rabbit Ab. Immunoblots were developed with ECL. The ratio of the mock sample is assigned a value of 1.0, and the values from IFN-γ-treated sample are normalized to this value. C, Calu-3 cells (5 × 10⁵/well) were grown in a 12-well Transwell plate. When the resistance of the monolayer reached 700–1000 ohms/cm2, cells were stimulated with or without IFN-γ (25 ng/ml) for 24 h. Cells were loaded with human IgG (top row) or chicken IgY (bottom row) (0.5 mg/ml) at 4°C in either the apical (lanes 2 and 3) or basolateral (lanes 4 and 5) chamber. Lane 1 represents an IgG or IgY H chain. Cells were warmed to 37°C to stimulate transcytosis, and medium was collected from the nonloading compartment 1 h later and subjected to Western blot-ECL analysis. The results are representative of at least three independent experiments. Band intensities of IgG heavy chain (HC) were compared by densitometry against IgG transported from mock-stimulated cells.
FIGURE 9
FIGURE 9
Schematic illustration of transcription factors binding to the promoter region of some MHC class I-related genes after IFN-γ treatment. Most information is derived from Gobin et al. (29). The ISREs of HLA-A, HLA-B, HLA-C, and HLA-F bind IRF-1 upon IFN-γ exposure and regulate the IFN-γ-induced transactivation of these genes (29, 32). The putative ISRE of HLA-E did not respond to IFN-γ stimulation, whereas an upstream GAS sequence of HLA-E is responsive to IFN-γ through STAT-1 activation (29, 73). HLA-G is responsive to IFN-γ via an upstream IFN-responsive regulatory sequences (31). Multiple putative ISREs of CD1D are predicted (74), but one is shown here. Human FcRn responds to IFN-γ through STAT-1 activation and binding to an upstream GAS sequence. In addition, several constitutive transcription factors are revealed to bind to the ISRE area. Sp1 binds to the GC-rich sequences in the ISRE areas of HLA-B, HLA-C, and HLA-G. The putative E box 5′ of the ISRE in most HLA-BE alleles is bound by USF-1 and USF-2 (29). Arrows represent the up- and down-regulation of gene expression upon IFN-γ exposure. The schematic structure of the gene promoter is not scaled.

Similar articles

Cited by

References

    1. Blumberg RS, Koss T, Story CM, Barisani D, Polischuk J, Lipin A, Pablo L, Green R, Simister NE. A major histocompatibility complex class I-related Fc receptor for IgG on rat hepatocytes. J Clin Invest. 1995;95:2397–2402. - PMC - PubMed
    1. Israel EJ, Taylor S, Wu Z, Mizoguchi E, Blumberg RS, Bhan A, Simister NE. Expression of the neonatal Fc receptor, FcRn, on human intestinal epithelial cells. Immunology. 1997;92:69–74. - PMC - PubMed
    1. Borvak J, Richardson J, Medesan C, Antohe F, Radu C, Simionescu M, Ghetie V, Ward ES. Functional expression of the MHC class I-related receptor, FcRn, in endothelial cells of mice. Int Immunol. 1998;10:1289–1298. - PubMed
    1. Zhu X, Meng G, Dickinson BL, Li X, Mizoguchi E, Miao L, Wang Y, Robert C, Wu B, Smith PD, et al. MHC class I-related Fc Receptor for IgG is functionally expressed in monocytes, intestinal macrophages, and dendritic cells. J Immunol. 2001;166:3266–3276. - PMC - PubMed
    1. Simister NE, Mostov KE. An Fc receptor structurally related to MHC class I antigens. Nature. 1989;337:184–187. - PubMed

Publication types

MeSH terms