

Non-invasive means of measuring hepatic fat content
- PMID: 18567074
- PMCID: PMC2716608
- DOI: 10.3748/wjg.14.3476
Non-invasive means of measuring hepatic fat content
Abstract
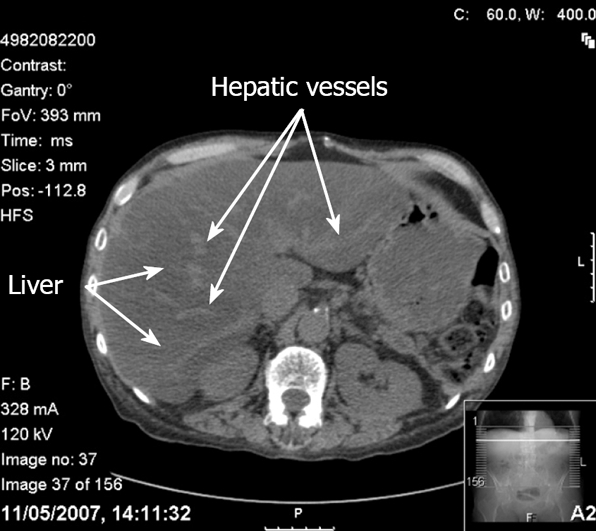
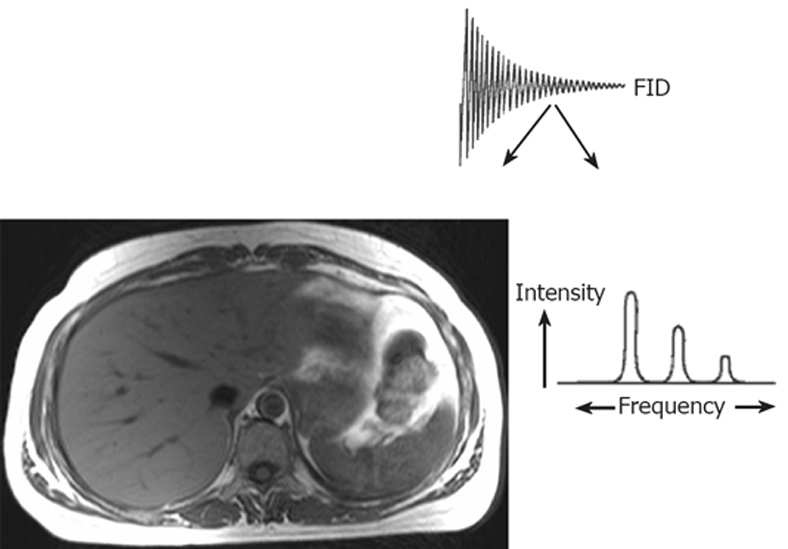
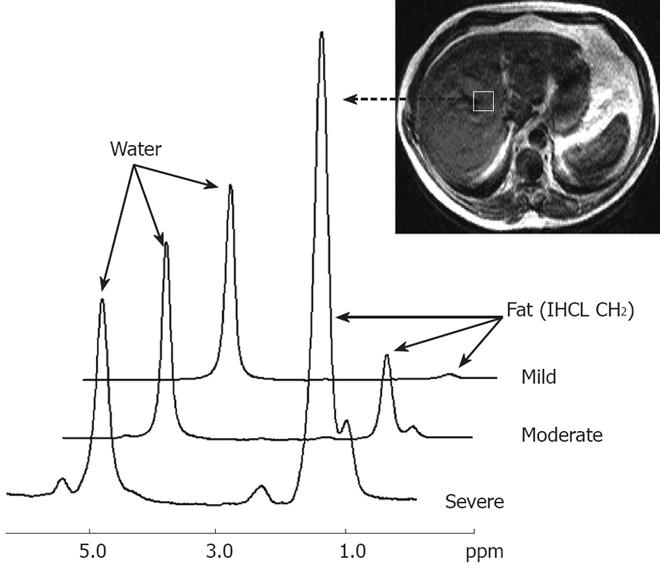
Hepatic steatosis affects 20% to 30% of the general adult population in the western world. Currently, the technique of choice for determining hepatic fat deposition and the stage of fibrosis is liver biopsy. However, it is an invasive procedure and its use is limited, particularly in children. It may also be subject to sampling error. Non-invasive techniques such as ultrasound, computerised tomography (CT), magnetic resonance imaging (MRI) and proton magnetic resonance spectroscopy ((1)H MRS) can detect hepatic steatosis, but currently cannot distinguish between simple steatosis and steatohepatitis, or stage the degree of fibrosis accurately. Ultrasound is widely used to detect hepatic steatosis, but its sensitivity is reduced in the morbidly obese and also in those with small amounts of fatty infiltration. It has been used to grade hepatic fat content, but this is subjective. CT can detect hepatic steatosis, but exposes subjects to ionising radiation, thus limiting its use in longitudinal studies and in children. Recently, magnetic resonance (MR) techniques using chemical shift imaging have provided a quantitative assessment of the degree of hepatic fatty infiltration, which correlates well with liver biopsy results in the same patients. Similarly, in vivo (1)H MRS is a fast, safe, non-invasive method for the quantification of intrahepatocellular lipid (IHCL) levels. Both techniques will be useful tools in future longitudinal clinical studies, either in examining the natural history of conditions causing hepatic steatosis (e.g. non-alcoholic fatty liver disease), or in testing new treatments for these conditions.
Figures


References
-
- Sanyal AJ. Mechanisms of Disease: pathogenesis of nonalcoholic fatty liver disease. Nat Clin Pract Gastroenterol Hepatol. 2005;2:46–53. - PubMed
-
- Kershaw EE, Flier JS. Adipose tissue as an endocrine organ. J Clin Endocrinol Metab. 2004;89:2548–2556. - PubMed
-
- Scherer PE. Adipose tissue: from lipid storage compartment to endocrine organ. Diabetes. 2006;55:1537–1545. - PubMed
-
- Yang Q, Graham TE, Mody N, Preitner F, Peroni OD, Zabolotny JM, Kotani K, Quadro L, Kahn BB. Serum retinol binding protein 4 contributes to insulin resistance in obesity and type 2 diabetes. Nature. 2005;436:356–362. - PubMed
-
- Zhang Y, Proenca R, Maffei M, Barone M, Leopold L, Friedman JM. Positional cloning of the mouse obese gene and its human homologue. Nature. 1994;372:425–432. - PubMed
Publication types
MeSH terms
Substances
Grants and funding
LinkOut - more resources
Full Text Sources
Other Literature Sources
Medical
