. 2008 Aug 15;283(33):22473-81.
doi: 10.1074/jbc.M803722200. Epub 2008 Jun 20.

Membrane composition modulates prestin-associated charge movement

Affiliations

Membrane composition modulates prestin-associated charge movement

John Sfondouris et al. J Biol Chem. .

Abstract

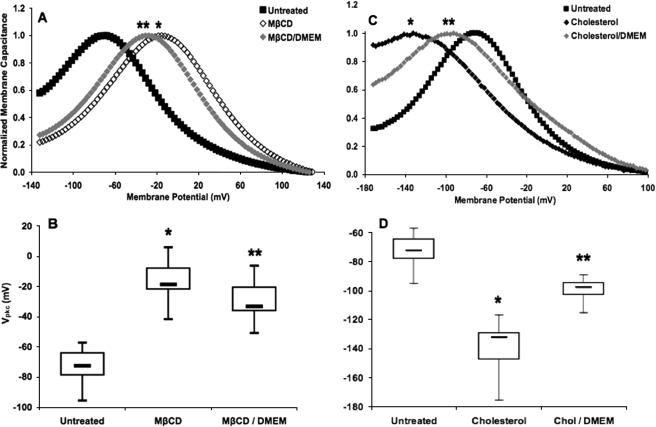
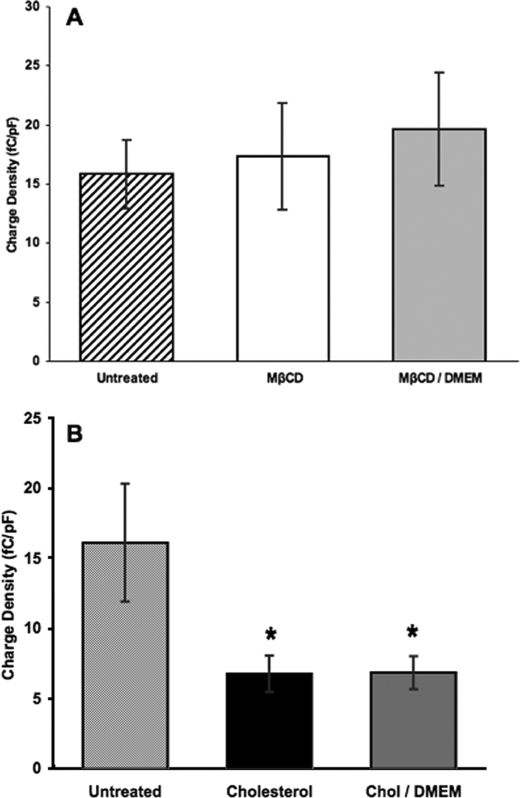
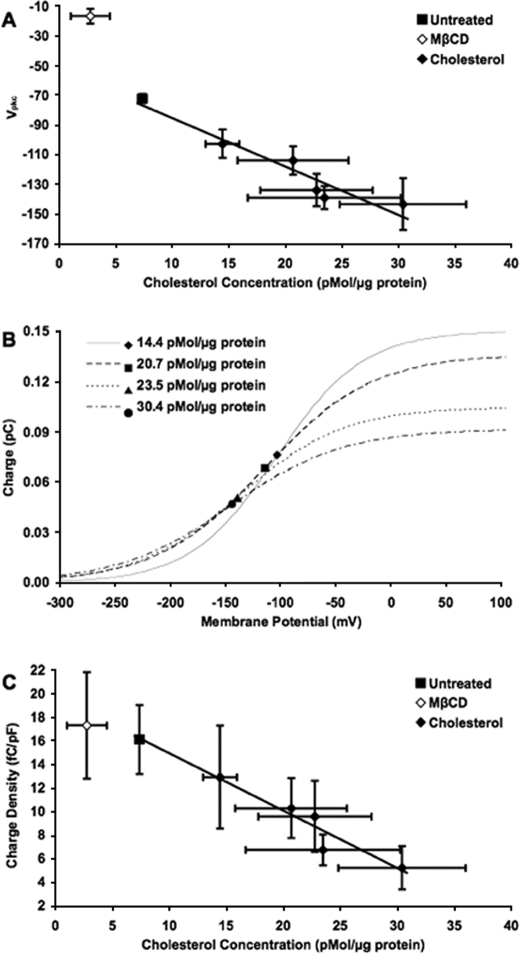
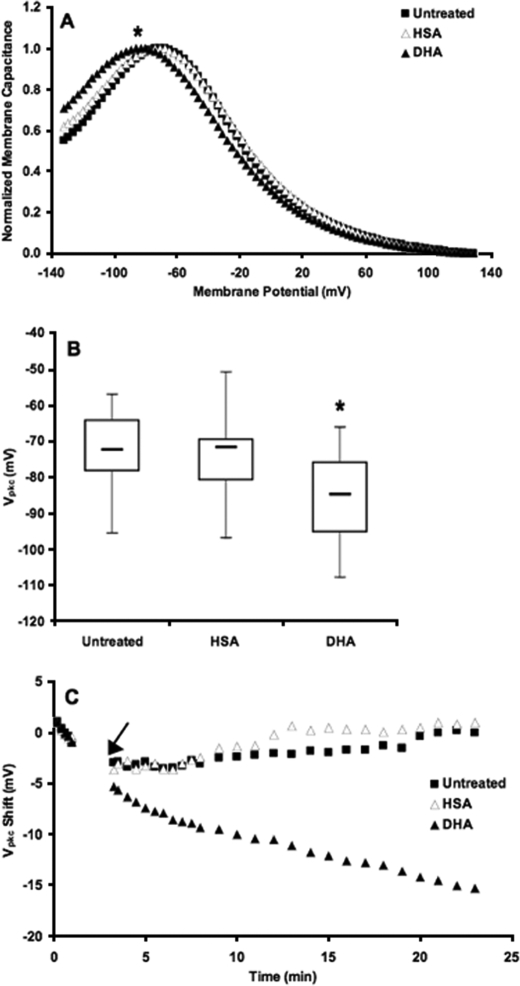
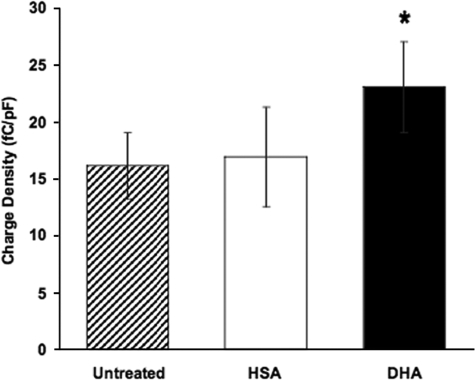
The lateral membrane of the cochlear outer hair cell (OHC) is the site of a membrane-based motor that powers OHC electromotility, enabling amplification and fine-tuning of auditory signals. The OHC membrane protein prestin plays a central role in this process. We have previously shown that membrane cholesterol modulates the peak voltage of prestin-associated nonlinear capacitance in vivo and in vitro. The present study explores the effects of membrane cholesterol and docosahexaenoic acid content on the peak and magnitude of prestin-associated charge movement in a human embryonic kidney (HEK 293) cell model. Increasing membrane cholesterol results in a hyperpolarizing shift in the peak voltage of the nonlinear capacitance (Vpkc) and a decrease in the total charge movement. Both measures depend linearly on membrane cholesterol concentration. Incubation of cholesterol-loaded cells in cholesterol-free media partially restores the Vpkc toward normal values but does not have a compensatory effect on the total charge movement. Decreasing membrane cholesterol results in a depolarizing shift in Vpkc that is restored toward normal values upon incubation in cholesterol-free media. However, cholesterol depletion does not alter the magnitude of charge movement. In contrast, increasing membrane docosahexaenoic acid results in a hyperpolarizing shift in Vpkc that is accompanied by an increase in total charge movement. Our results quantify the relation between membrane cholesterol concentration and prestin-associated charge movement and enhance our understanding of how membrane composition modulates prestin function.


Figures

FIGURE 1.
FIGURE 1.
Steady-state cholesterol depletion- and loading-induced shifts in Vpkc return toward control values upon incubation in bathing media. A, the mean Vpkc in untreated cells (▪, n = 39), which had a membrane cholesterol concentration of 7.4 pmol/μg protein, was approximately –72 mV. Cells treated with MβCD (⋄, n = 25) to a membrane cholesterol concentration of 2.8 pmol/μg of protein exhibited a large and significant depolarizing shift to a mean Vpkc of –17 mV (*, p < 1 × 10–21). Cells treated with MβCD and incubated in bathing media (♦, n = 24) had a mean Vpkc of –29 mV. Although this is a significant depolarizing shift relative to the control Vpkc (p < 1 × 10–17), it is also a significant reduction in the shift seen for MβCD treatment alone (**, p < 0.002). The traces shown here and in subsequent NLC plots are representative of cells within a treatment group, and each capacitance trace was normalized with respect to peak and base-line capacitance values. B, the box plots represent the distribution of steady-state Vpkc values for each treatment. C, cholesterol-loaded cells with a membrane cholesterol concentration of 23.5 pmol/μg of protein (♦, n = 19) exhibited a large and significant hyperpolarizing shift to a mean Vpkc of –139 mV (*, p < 1 × 10–13). Cells exposed to the same cholesterol treatment followed by incubation in bathing media (♦, n = 14) had a mean Vpkc of –99 mV. Although this is a significant hyperpolarizing shift relative to the control Vpkc (p < 1 × 10–11), it is also a significant reduction in the shift seen for cholesterol treatment alone (**, p < 1 × 10⁻⁸). D, the box plots represent the distribution of steady-state Vpkc values for each treatment. Ticks in these and subsequent box plots mark the maximum and minimum values, boxes contain values falling between the first and third quartiles, and bars mark the median value for each group.
FIGURE 2.
FIGURE 2.
Cholesterol depletion does not significantly alter charge density, whereas cholesterol loading causes a decrease in charge density that does not return toward control values upon incubation in bathing media. A, the mean charge density in untreated cells (striped, membrane cholesterol 7.4 pmol/μg of protein; n = 39) was 16.1 fC/pF. Cells treated with MβCD (white, membrane cholesterol 2.8 pmol/μg of protein; n = 25) had a mean charge density of 17.3 fC/pF which was not significantly altered relative to untreated cells (p > 0.65). Cells treated with MβCD and incubated in bathing media (light gray, n = 24) had a mean charge density of 19.6 fC/pF which was not significantly altered relative to untreated (p > 0.21) or MβCD-treated cells (p > 0.48). B, the histogram represents the mean charge density for untreated cells (striped), cells loaded to a membrane cholesterol concentration of 23.5 pmol/μg protein (black, n = 19), and cells loaded to a membrane cholesterol concentration of 23.5 pmol/μg protein and incubated in bathing media (dark gray, n = 14). The mean charge density was significantly reduced in both cholesterol-loaded cells (6.8 fC/pF, p < 1 × 10⁻⁶) and cholesterol-loaded cells incubated in bathing media (6.8 fC/pF; *, p < 1 × 10⁻⁶), with no significant difference between the two (p > 0.92). Error bars in both graphs represent 2 S.E. in either direction relative to the mean.
FIGURE 3.
FIGURE 3.
Cholesterol loading alters both Vpkc and charge density in a concentration-dependent manner. A, shown is a plot of the mean Vpkc (mV) versus the membrane cholesterol concentration (pmol/μg of protein). In untreated cells (▪, membrane cholesterol 7.4 pmol/μg of protein; n = 39), the mean Vpkc was approximately –72 mV. In MβCD-treated cells (⋄, membrane cholesterol 2.8 pmol/μg of protein; n = 25), the mean Vpkc was –17 mV. The series of cholesterol-treated cell groups (♦, n = 10, 7, 11, 19, and 8) had membrane cholesterol concentrations ranging from 14.4 to 30.4 pmol/μg protein and Vpkc values ranging from –103 to –143 mV. A significant hyperpolarizing shift was seen in Vpkc for each group of cholesterol-loaded cells relative to the control (p < 0.0001), and the shifts became larger as membrane cholesterol concentration increased. A linear regression function has been fit to the control and cholesterol-loading data (y = –3.26x – 52.7, R2 = 0.923). B, the curves represent the mean charge moved (pC) versus voltage (mV) for cholesterol-loaded cells at membrane cholesterol concentrations of 14.4 (solid line, n = 10), 20.7 (dashed line, n = 7), 23.5 (dotted line, n = 19) and 30.4 pmol/μg of protein (dash-dotted line, n = 7). The charge at Vpkc is labeled for each treatment (♦, ▪, ▴, and •, respectively). The total charge movement, represented by the height of the curve, decreased as membrane cholesterol concentration increased. C, as the membrane cholesterol concentration was increased, the mean charge density (fC/pF) decreased. The mean charge densities for untreated cells (▪, n = 39) and MβCD-treated cells (⋄, n = 25) were 16.1 and 17.3 fC/pF, respectively. The series of cholesterol-treated cell groups (♦, n = 10, 7, 11, 19, and 7) had mean charge densities ranging from 5.2 to 12.9 fC/pF. A linear regression function has been fit to the control and cholesterol-loading data (y = –0.486x + 19.8, R2 = 0.952). In A and C, horizontal and vertical error bars represent 2 S.E. in either direction relative to the mean.
FIGURE 4.
FIGURE 4.
DHA shifts Vpkc. A, the mean Vpkc in untreated cells (▪, n = 39) was approximately –72 mV. Cells treated with HSA alone (▵, n = 30) exhibited no significant change in Vpkc relative to untreated cells (p > 0.46). In cells loaded with DHA (▴, n = 41), the mean Vpkc shifted in the hyperpolarizing direction to approximately –85 mV. This shift was statistically significant with respect to both untreated and HSA-treated cells (*, p < 0.0002). B, the box plots represent the distribution of steady-state Vpkc values for each treatment. C, shown is the change in Vpkc as a function of time after the establishment of a whole-cell patch. HSA (▵, n = 10–13) and DHA (▴, n = 17–18) were added 3 min after the patch was established, as indicated by the arrow. Vpkc changes rapidly upon the addition of DHA. Untreated (▪, n = 13–21) and HSA-treated cells have similar kinetic values, indicating that HSA does not contribute to the shift seen with DHA loading. The traces shown are averages from each respective group of the change in Vpkc of individual cells relative to their initial values.
FIGURE 5.
FIGURE 5.
DHA increases charge density. The mean charge density in untreated cells (striped, n = 39) was 16.1 fC/pF. Cells treated with HSA alone (white, n = 30) exhibited no significant change in charge density relative to untreated cells (16.9 fC/pF, p > 0.75). In cells loaded with DHA (black, n = 41), the mean charge density increased to 23.0 fC/pF. This shift was statistically significant with respect to untreated (p < 0.007) and HSA-treated cells (*, p < 0.044). Error bars represent 2 S.E. in either direction relative to the mean.

Similar articles

Cited by

References

    1. Brownell, W. E., Bader, C. R., Bertrand, D., and de Ribaupierre, Y. (1985) Science 227 194–196 - PubMed
    1. Dallos, P., Evans, B. N., and Hallworth, R. (1991) Nature 350 155–157 - PubMed
    1. Kalinec, F., Holley, M. C., Iwasa, K. H., Lim, D. J., and Kachar, B. (1992) Proc. Natl. Acad. Sci. U. S. A. 89 8671–8675 - PMC - PubMed
    1. Huang, G., and Santos-Sacchi, J. (1994) Proc. Natl. Acad. Sci. U. S. A. 91 12268–12272 - PMC - PubMed
    1. Brownell, W. E., Spector, A. A., Raphael, R. M., and Popel, A. S. (2001) Annu. Rev. Biomed. Eng. 3 169–194 - PubMed

Publication types

LinkOut - more resources