. 2008 Jul 1;105(26):8896-901.
doi: 10.1073/pnas.0803577105. Epub 2008 Jun 20.

Protonation and sugar binding to LacY

Affiliations

Protonation and sugar binding to LacY

Irina N Smirnova et al. Proc Natl Acad Sci U S A. .

Abstract

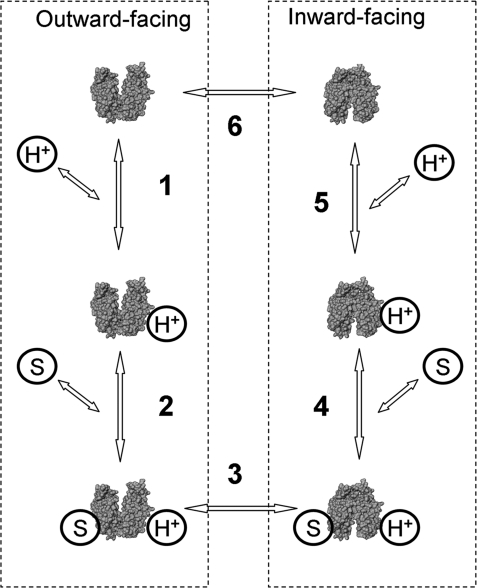
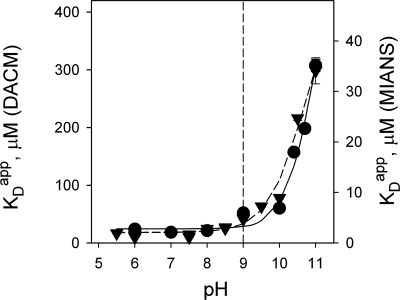
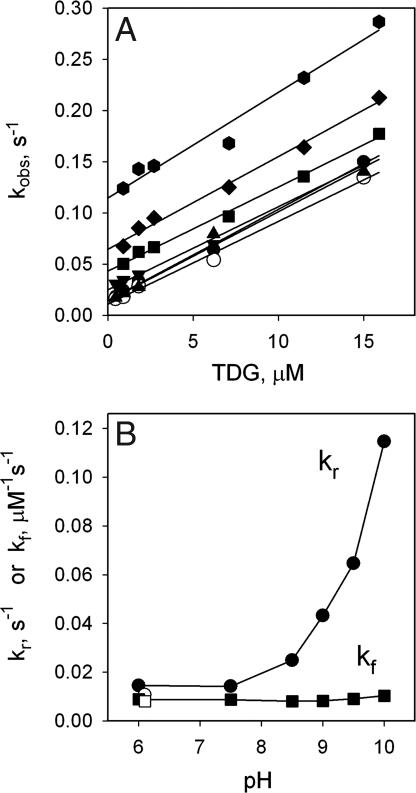
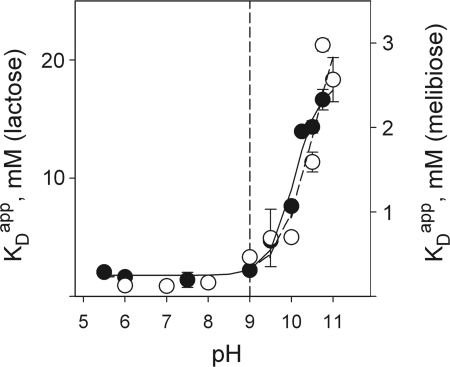
The effect of bulk-phase pH on the apparent affinity (K(d)(app)) of purified wild-type lactose permease (LacY) for sugars was studied. K(d)(app) values were determined by ligand-induced changes in the fluorescence of either of two covalently bound fluorescent reporters positioned away from the sugar-binding site. K(d)(app) for three different galactopyranosides was determined over a pH range from 5.5 to 11. A remarkably high pK(a) of approximately 10.5 was obtained for all sugars. Kinetic data for thiodigalactoside binding measured from pH 6 to 10 show that decreased affinity for sugar at alkaline pH is due specifically to increased reverse rate. A similar effect was also observed with nitrophenylgalactoside by using a direct binding assay. Because affinity for sugar remains constant from pH 5.5 to pH 9.0, it follows that LacY is fully protonated with respect to sugar binding under physiological conditions of pH. The results are consistent with the conclusion that LacY is protonated before sugar binding during lactose/H(+) symport in either direction across the membrane.


Conflict of interest statement

The authors declare no conflict of interest.

Figures

Fig. 1.
Fig. 1.
Kinetic scheme for lactose/H+ transport cycle. Six steps include protonation/deprotonation of LacY (1 and 5), substrate binding/release (2 and 4), and conformational changes (3 and 6). Steps 2, 3, and 4 are involved in equilibrium exchange and entrance counterflow that proceed without deprotonation (5, 7).
Fig. 2.
Fig. 2.
Effect of sugar binding on fluorescence of DACM- or MIANS-labeled LacY. (A) Overall structure of LacY [Protein Data Bank (PDB) ID code 1pv7] with TDG occupying the sugar-binding site in the middle of the molecule at the apex of the hydrophilic cavity opened to the cytoplasmic side. The black sphere represents Cα atom of position 331 where the V331C mutation was introduced. LacY structure is displayed by using Pymol 0.97 (DeLano Scientific). (B and C) Structures of fluorophores and emission spectra of V331C LacY labeled with DACM or MIANS, respectively. Solid line, no sugar added or 10 mM sucrose; broken line, 10 mM TDG added. The spectra were recorded at 0.4 μM protein in 50 mM NaPi (pH 7.5), 0.02% DDM with excitation wavelengths of 397 nm or 330 nm for DACM- or MIANS-labeled LacY, respectively.
Fig. 3.
Fig. 3.
TDG binding to DACM-labeled or MIANS-labeled V331C LacY. (A) Dependence of fluorescence on TDG concentration as percentage of initial emission level before TDG addition for each fluorophore. Titration traces were recorded as a function of time at 0.4 μM protein with excitation and emission wavelengths of 397 and 440 nm for DACM-labeled or 330 and 415 nm for MIANS-labeled LacY, respectively. Solid lines are hyperbolic fits to the data with estimated Kdapp values of 21.4 ± 0.4 and 1.2 ± 0.1 μM for DACM- and MIANS-labeled LacY, respectively. ●, DACM; ▾, MIANS. (B) Kinetics of TDG binding to DACM-labeled LacY. Concentration dependence of the rates (kobs) of the fluorescence changes was measured at 0.4 μM protein in 50 mM NaPi (pH 7.5), 0.02% DDM. Data were collected after rapid mixing of equal volumes of TDG and labeled protein by stopped-flow. Final concentrations of TDG are shown. Rates were estimated from single exponential fitting to time traces. Each point is an average of five to seven measurements. Linear fit to the data is shown as a solid line. The intercept with the y axis is kr (1.0 ± 0.1 s−1), and the slope is kf (28.66 ± 0.02 mM−1s−1). Estimated Kdapp (kr/kf) is 34.9 ± 3.5 μM. (C) Kinetics of TDG binding to MIANS-labeled LacY. Measurements were done as described above. Data were collected by stopped-flow at TDG concentrations from 0.05 to 4 mM and from time traces at TDG concentrations from 0.45 to 15 μM. Estimated parameters are kr = 0.011 ± 0.001 s−1; kf = 10.81 ± 0.03 mM−1s−1; and Kdapp = 1.0 ± 0.1 μM.
Fig. 4.
Fig. 4.
Effect of pH on Kdapp for TDG with DACM-labeled or MIANS-labeled V331C LacY. Time traces from TDG titration experiments were recorded at indicated ambient pH values with excitation and emission wavelengths at 397 and 440 nm for DACM- or 330 and 415 nm for MIANS-labeled LacY, respectively. Data collection and fitting details were as described in Fig. 3A (see also Figs. S3–S5). Kdapp values estimated from titrations at each pH were plotted versus H+ concentration and fitted with a hyperbolic equation (see Fig. S5); they are presented as a function of pH. Estimated pKa values are 10.9 and 10.7 for DACM-labeled (●) and MIANS-labeled (▾) V331C LacY.
Fig. 5.
Fig. 5.
Kinetics of TDG binding to MIANS-labeled V331C LacY as a function of pH. (A) TDG concentration dependence of the rate of fluorescence change (kobs) at given ambient pH values. Details of data collection and fitting are described in Fig. 3. Solid lines are linear fits to each dataset at pH 6 (●), 7.5 (▴), 8.5 (▾), 9.0 (■), 9.5 (♦), and 10.0 (⬣). ○, control experiment at pH 6.1 with labeled protein preincubated at pH 11.0 for 12 min. (B) Kinetic parameters of kr (●) and kf (■) estimated from A for each dataset are plotted as a function of pH. ○, □, kf and kr, respectively, for protein preincubated at pH 11.0 for 12 min and returned to pH 6.1 (in addition, see Fig. S6 for comparison of Kdapp values calculated from kinetic parameters and obtained from titration data).
Fig. 6.
Fig. 6.
Effect of pH on Kdapp for lactose or melibiose with MIANS-labeled V331C LacY. Experimental manipulations, data collection, and curve fitting were carried out as described in Fig. 4 (in addition, see Fig. S7). Estimated pKa values are 10.1 and 10.5 for lactose (●) and melibiose (○), respectively.
Fig. 7.
Fig. 7.
Configuration of residues involved in H+ translocation in LacY located in C-terminal 6-helix bundle (PDB ID code 1pv7) presented as green sticks. Bound TDG is shown as spheres. (A) Viewed parallel to the membrane. (B) Viewed along the membrane normal from the cytoplasmic side. LacY structure is displayed by using Pymol 0.97 (DeLano Scientific).

References

    1. Saier MH, Jr, et al. The major facilitator superfamily. J Mol Microbiol Biotechnol. 1999;1:257–279. - PubMed
    1. Saier MH., Jr Families of transmembrane sugar transport proteins. Mol Microbiol. 2000;35:699–710. - PubMed
    1. West IC. Lactose transport coupled to proton movements in Escherichia coli. Biochem Biophys Res Commun. 1970;41:655–661. - PubMed
    1. West IC, Mitchell P. Stoichiometry of lactose-H+ symport across the plasma membrane of Escherichia coli. Biochem J. 1973;132:587–592. - PMC - PubMed
    1. Kaback HR, Sahin-Toth M, Weinglass AB. The kamikaze approach to membrane transport. Nat Rev Mol Cell Biol. 2001;2:610–620. - PubMed

Publication types

LinkOut - more resources