. 2008 Jun;6(6):1003-16.
doi: 10.1158/1541-7786.MCR-07-2144.

Multiple signaling pathways are responsible for prostaglandin E2-induced murine keratinocyte proliferation

Affiliations

Multiple signaling pathways are responsible for prostaglandin E2-induced murine keratinocyte proliferation

Kausar M Ansari et al. Mol Cancer Res. 2008 Jun.

Abstract

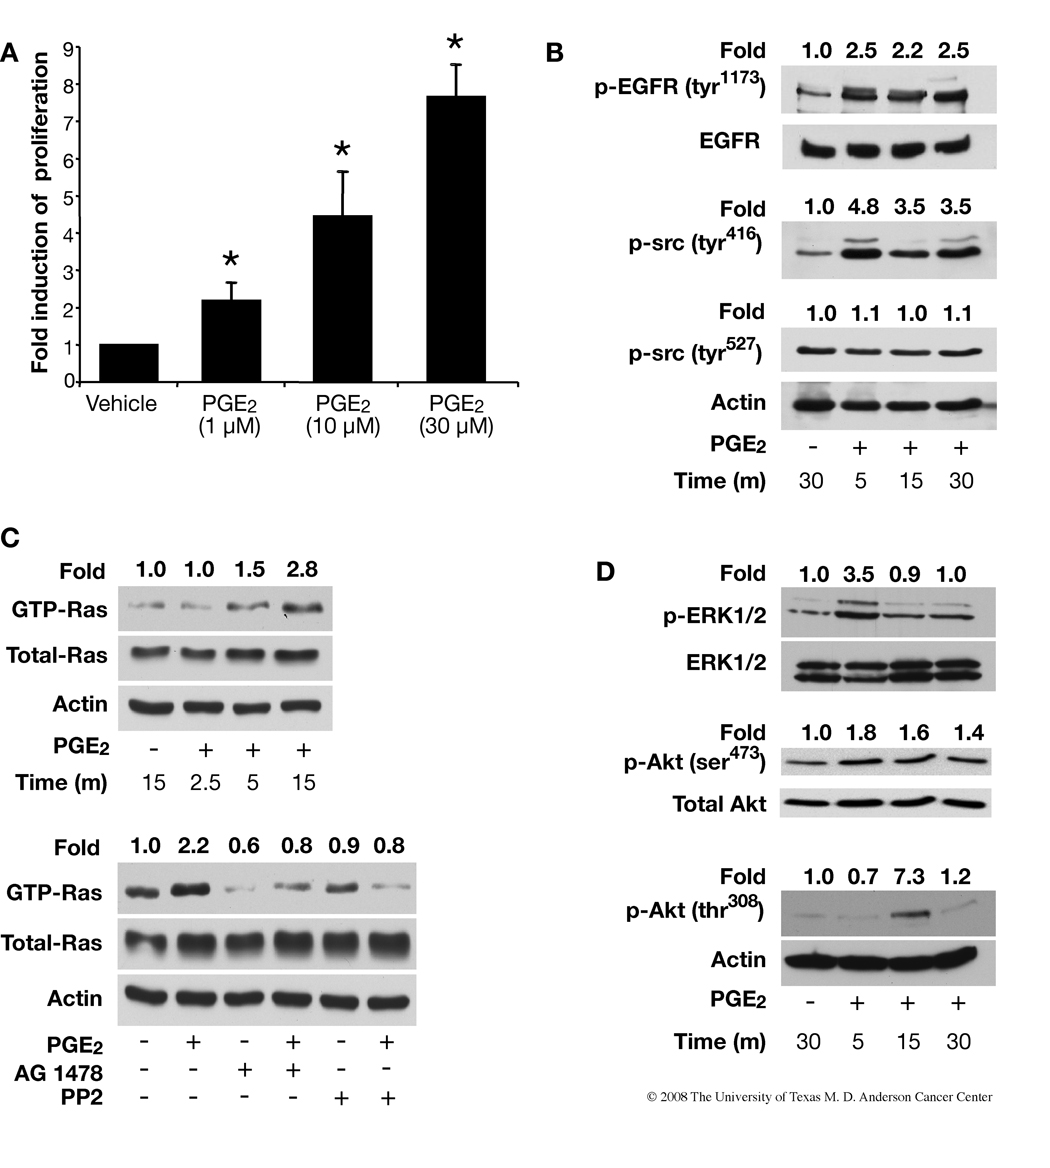
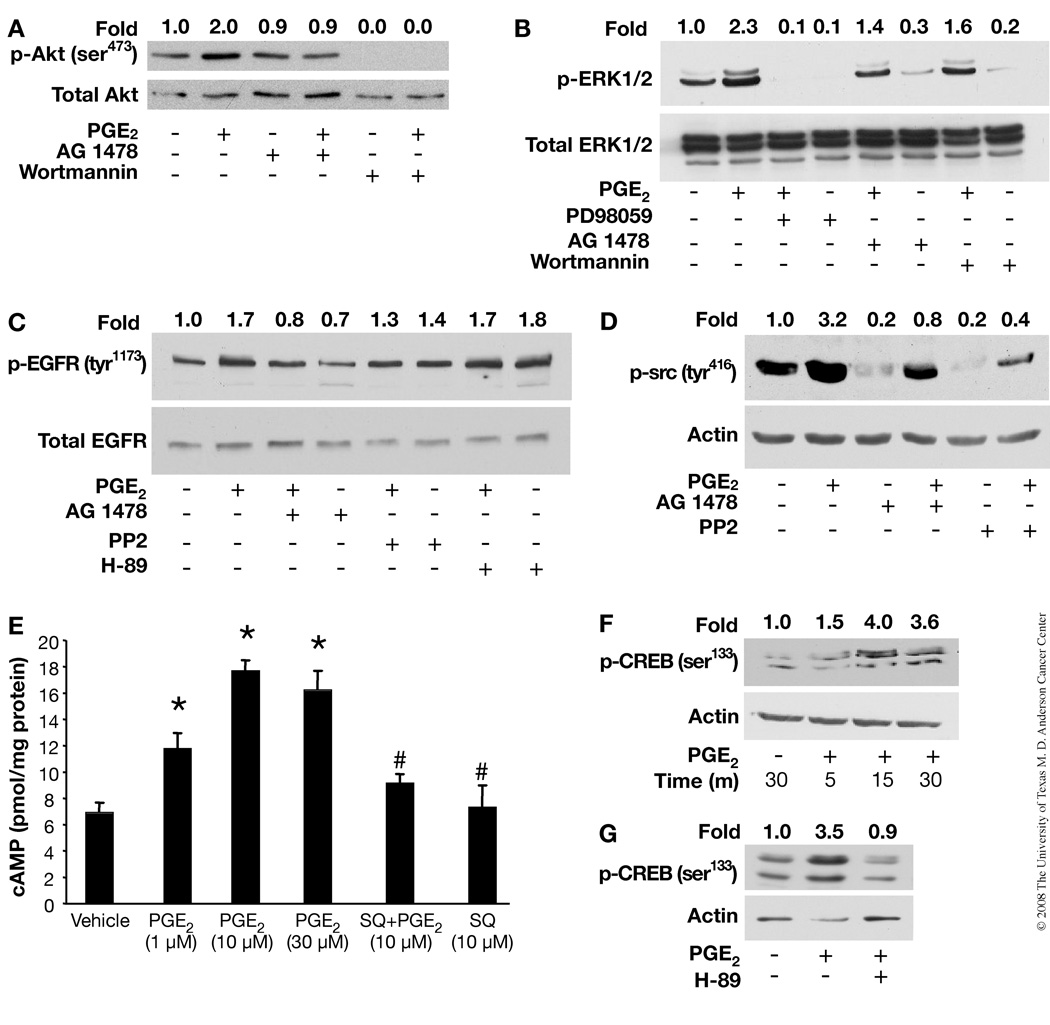
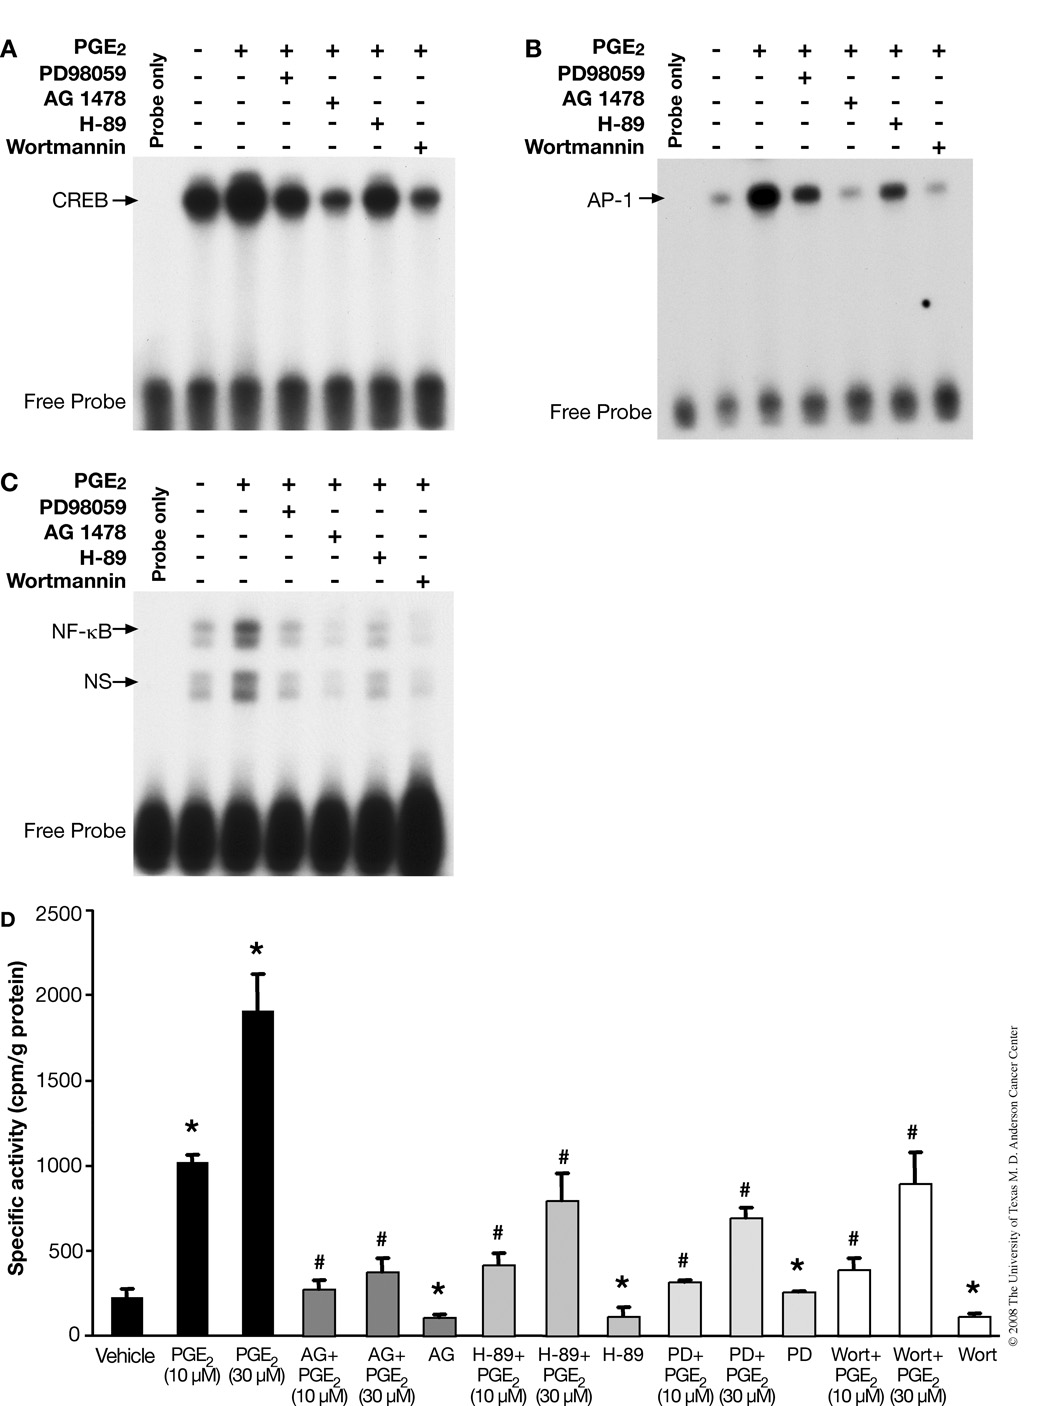
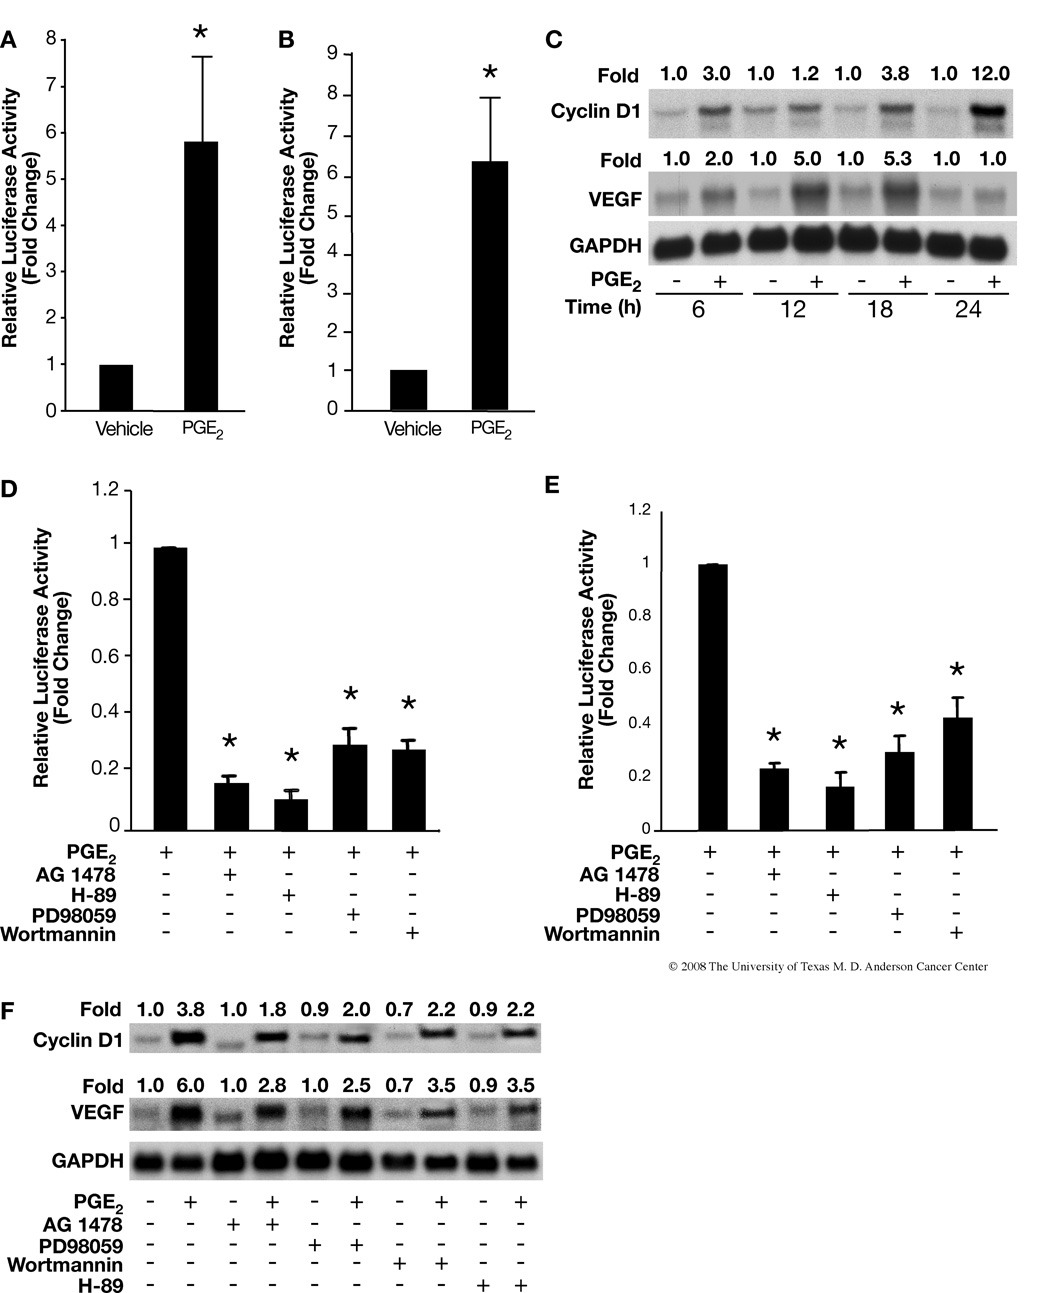
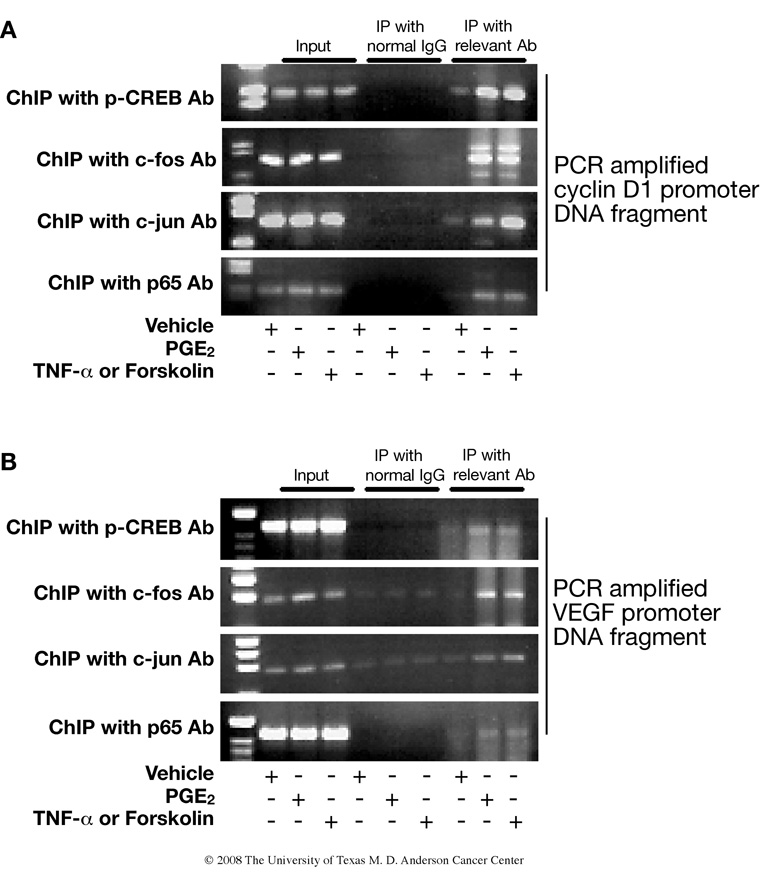
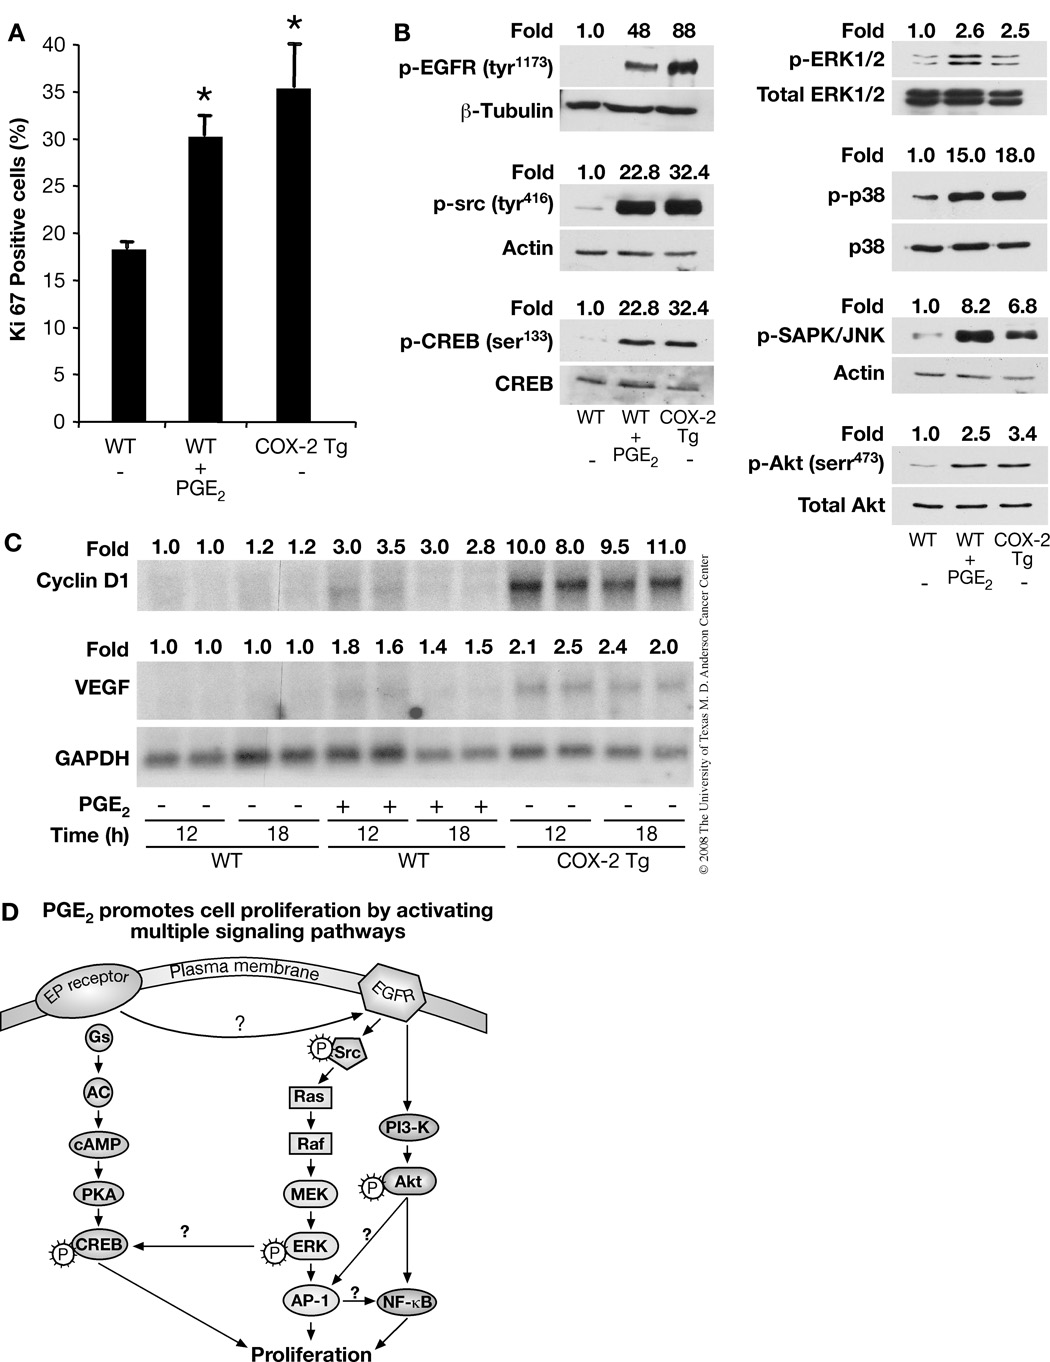
Although prostaglandin E2 (PGE2) has been shown by pharmacologic and genetic studies to be important in skin cancer, the molecular mechanism(s) by which it contributes to tumor growth is not well understood. In this study, we investigated the mechanisms by which PGE2 stimulates murine keratinocyte proliferation using in vitro and in vivo models. In primary mouse keratinocyte cultures, PGE2 activated the epidermal growth factor receptor (EGFR) and its downstream signaling pathways as well as increased cyclic AMP (cAMP) production and activated the cAMP response element binding protein (CREB). EGFR activation was not significantly inhibited by pretreatment with a c-src inhibitor (PP2), nor by a protein kinase A inhibitor (H-89). However, PGE2-stimulated extracellularly regulated kinase 1/2 (ERK1/2) activation was completely blocked by EGFR, ERK1/2, and phosphatidylinositol 3-kinase (PI3K) pathway inhibitors. In addition, these inhibitors attenuated the PGE2-induced proliferation, nuclear factor-kappa B, activator protein-1 (AP-1), and CREB binding to the promoter regions of the cyclin D1 and vascular endothelial growth factor (VEGF) genes and expression of cyclin D1 and VEGF in primary mouse keratinocytes. Similarly, in vivo, we found that WT mice treated with PGE2 and untreated cyclooxygenase-2-overexpressing transgenic mice had higher levels of cell proliferation and expression of cyclin D1 and VEGF, as well as higher levels of activated EGFR, nuclear factor-kappa B, AP-1, and CREB, than vehicle-treated WT mice. Our findings provide evidence for a link between cyclooxygenase-2 overexpression and EGFR-, ERK-, PI3K-, cAMP-mediated cell proliferation, and the tumor-promoting activity of PGE2 in mouse skin.


Figures

FIGURE 1
FIGURE 1
Effect of PGE2 on keratinocyte proliferation and EGFR, Ras- ERK1/2, and Akt signaling pathways in primary mouse keratinocytes (PMKs). A. PGE2 increases keratinocyte proliferation in a dose-dependent manner. PMKs from WT mice were treated with PGE2 (10–30 µM) for 20 h and pulsed with (3H)-thymidine for 2 h before harvest. The (3H)-thymidine incorporated by PMKs was measured and normalized to protein concentration. Data are presented as fold induction of specific activity. At least 2 independent experiments were done, with triplicates for each treatment group; data from a representative experiment are shown as means±SD. *p<0.05, significant when compared to the vehicle-treated group. B. Phosphorylation of EGFR and c-src was determined by western blotting using anti-p-EGFR (tyr1173) and anti-p-src (tyr416 and tyr527) antibodies. Blots were reprobed with anti-EGFR or anti-actin antibody for loading control. C. Top panels, PMKs were treated with PGE2 (10 µM) for the indicated times after serum-starvation for 24 h. GTP-bound Ras was affinity-precipitated and detected by western blotting using a pan-Ras antibody. Total Ras protein and actin show equal protein in each sample. Bottom panels, Effect of an EGFR inhibitor (AG1478) or c-src inhibitor (PP2) on PGE2-induced GTP-Ras activation. The PMKs were pretreated with the indicated inhibitors for 30 min after serum starvation for 24 h and then incubated with PGE2 (10 µM) for 5 min. Ras activation was measured as described in experimental procedures. D. PGE2 (10 µM) induces phosphorylation of ERK1/2 and Akt (ser473 and thr308) in PMKs after PGE2 treatment for the indicated time points. The same blots were reprobed with anti-ERK1/2 or anti-actin antibody for loading controls. Quantitation of the intensities of the bands were determined by densitometry and the relative ratios of the activated Ras, EGFR, c-src, ERK1/2 and Akt to total Ras, EGFR, ERK1/2 or actin were normalized to the vehicle-treated samples and are shown above each lane.
FIGURE 2
FIGURE 2
Effect of pharmacological inhibitors on PGE2-induced cAMP production and EGFR, c-src, ERK1/2, Akt and PKA/ CREB signaling pathways in PMKs. PMKs were serum starved for 24 h prior to treating with vehicle or PGE2 (10 µM) for 5 min. Pathway-specific inhibitors were added 30 min before PGE2 treatment. Western blots of proteins from whole cell lysates were performed with antibodies to the proteins indicated. A. Akt and EGFR inhibitors inhibit PGE2-induced Akt activation. Both AG1478 (EGFR inhibitor) and wortmannin (Akt inhibitor) blocked PGE2-stimulated phosphorylation of Akt (ser473). B. Effect of MEK, EGFR, and Akt inhibitors on ERK1/2 activation. PD98059 (MEK/ERK inhibitor) completely blocked PGE2-stimulated ERK1/2 phosphorylation, while AG1478 and wortmannin were only partially effective. C. Effect of EGFR, c-src, and PKA inhibitors on EGFR activation. AG1478 as expected blocked PGE2-stimulated EGFR phosphorylation (tyr1173), while PP2 (c-src inhibitor) and H-89 (PKA inhibitor) had little or no effect. D. EGFR and c-src inhibitors block PGE2-induced c-src activation. Both AG1478 and PP2 completely inhibit PGE2-stimulated phosphorylation of c-src (tyr416). E. PGE2 induces cAMP production. Serum-starved PMKs were treated with PGE2 (0–30 µM) for 30 min with or without a 20 min pretreatment with SQ 22,536 (10 µM), an adenylate cyclase inhibitor. The mean (±SD) levels of cAMP from triplicate samples are expressed as pmol/mg protein. *p<0.05, significant when compared to the vehicle-treated group and #p<0.05, significant when compared to the PGE2 (10 µM)-treated group. F. PGE2 induces CREB activation. Serum-starved PMKs were treated with vehicle or PGE2 (10 µM) for the indicated times. PGE2 stimulated phosphorylation of CREB (ser133) maximally at 15 min. G. PKA inhibitor blocks PGE2-induced CREB activation. Pretreatment of PMKs with H-89 for 30 min prior to PGE2 (10 µM) treatment for 10 min inhibited phosphorylation of CREB (ser133). Quantitation of the intensities of the bands was determined by densitometry and the relative ratios of the activated Ras, EGFR, c-src, ERK1/2 or Akt to total Ras, EGFR, ERK1/2 or actin was normalized to the vehicle samples and are shown above each lane.
FIGURE 3
FIGURE 3
PGE2-induces activation of CREB, AP-1 and NF-κB transcription factors in PMKs. PMKs were incubated with vehicle (control, lane 2) or with PGE2 (10 µM) (lanes 3–7) for 15 min. To demonstrate the effect of phamacological inhibitors on PGE2-induced transcription factor-binding, PMKs were treated with PD98059, AG1478, H-89 or wortmannin for 30 min prior to PGE2 treatment. Nuclear extracts were subjected to electrophoretic mobility shift assay analysis, as described in experimental procedures. A. PGE2-induced CREB activation in PMKs. The arrow indicates the specific binding of CREB to its consensus oligonucleotide. B. PGE2-induced AP-1 activation in PMKs. The arrow indicates the specific binding of AP-1 to its consensus oligonucleotide. C. PGE2-induced NF-κB activation in PMKs. The arrows indicate the specific binding of NF-κB to its consensus oligonucleotide (upper arrow) and non-specific (ns) binding (lower arrow). D. EGFR, ERK1/2, PKA/CREB and PI3-K/Akt signaling cascades are involved in PGE2-stimulated cell proliferation. PMKs were treated with various kinase inhibitors 30 min prior to PGE2 (10 µM) treatment for 20 h and pulsed with (3H)-thymidine 2 h before harvest. The (3H)-thymidine incorporated by PMKs was measured in triplicate samples and normalized to protein concentration as described in experimental procedures. Representative data from at least 2 independent experiments are presented as the means ± SD. *p<0.05, significant when compared to vehicle-treated groups and #p<0.05, significant when compared to PGE2-treated groups.
FIGURE 4
FIGURE 4
PGE2 up-regulates cyclin D1 and VEGF expression via activation of EGFR, MAPK, cAMP/CREB and/or PI3-K/Akt cascade. PMKs were transiently transfected with cyclin D1 (A) or VEGF (B), promoter luciferase reporter constructs and CMV-β-gal plasmid followed by treatment with vehicle or PGE2 (10 µM) for 24 h. Data are presented as fold induction of relative luciferase activity. Representative data from at least 2 independent experiments using triplicates for each treatment group are presented as the means ± SD. *p<0.05, significant when compared to the vehicle treatment group. C. Effects of PGE2 on mRNA expression of cyclin D1 and VEGF. PMKs were treated with PGE2 (10 µM) for the indicated time points. RNA was isolated from the PMKs and northern blots were hybridized sequentially with cDNA probes for cyclin D1, VEGF and GAPDH (loading control). Quantitation of the intensities of the bands was determined by densitometry and the ratios of cyclin D1 and VEGF to GAPDH are shown above each lane. D and E, Specific inhibitors block PGE2 induction of cyclin D1 (D) and VEGF (E), promoter activities. Cells were pretreated with inhibitors for 30 min before the PGE2 (10 µM) treatment. Data are presented as fold induction of relative luciferase activity. Representative data from at least 2 independent experiments using triplicates for each treatment group are presented as means ± SD. *p<0.05, significant when compared to PGE2 treated group. F. Effect of specific inhibitors on PGE2-induced mRNA expression of cyclin D1 and VEGF. PMKs were pretreated with inhibitors for 30 min before the PGE2 (10 µM) treatment for 18 h. RNA was isolated and probed as (C). Quantitation of the intensities of the bands were determined by densitometry and the ratios of cyclin D1 and VEGF to GAPDH are shown above each lane.
FIGURE 5
FIGURE 5
Chromatin immunoprecipitation assay demonstrates in vivo binding of CREB, AP-1 and NF-κB to the promoter regions of cyclin D1 and VEGF. PMKs were treated with vehicle, PGE2 (10 µM), TNF-α (10 ng/ml) or forskolin (10 µM) for 30 min. Chromatin fragments were immunoprecipitated with antibodies against phospho-CREB, c-Fos, c-Jun, p65 of NF-κB or with control rabbit immunoglobulin. Chromatin-bound DNA and input (original nuclear extract) was subjected to PCR amplification using primers specific for promoter regions of cyclin D1 (A) and VEGF (B). TNF-α and forskolin were used as positive controls for induction of AP-1, NF-κB and CREB, respectively.
FIGURE 6
FIGURE 6
Exogenous, as well as endogenous, PGE2 triggers mitogenic signaling pathways and increases the mRNA expression of cyclin D1 and VEGF and induces cell proliferation in vivo. A. The number of Ki-67 positive basal epidermal keratinocytes were determined in vehicle- or PGE2 (30 µg/mouse) treated WT and vehicle-treated K14.COX-2 transgenic mice. The mean percentage of positive cells ± SD for each treatment group are shown. Differences between vehicle-treated WT and PGE2-treated WT or vehicle-treated COX-2 transgenic (*) mice were significant, p<0.05. B. WT mice were treated with vehicle or 30 µg PGE2, and K14.COX2 transgenic mice were treated with vehicle for 15 min before sacrifice. Epidermal lysates from 3 mice in each group were pooled together and phosphorylation of EGFR (tyr1173), c-src (tyr416), CREB (ser133), ERK1/2, p38, JNK/SAPK, Akt (ser473) and total EGFR, CREB, ERK1/2, p38, Akt or actin were analyzed by western blotting. Quantitation of the intensities of the bands shown were determined by densitometry and the relative ratios of phosphorylated forms to total EGFR, total ERK1/2, total p38, total Akt or actin were normalized to the vehicle-treated samples and are shown above each lane. This experiment was repeated without pooling lysates and gave similar results. C. Effects of exogenous and endogenous PGE2 on mRNA expression of cyclin D1 and VEGF in vivo. WT mice and K14.COX2 transgenic mice were treated as (B). These 3 groups of mice were sacrificed at the indicated times after PGE2 or vehicle treatment. RNA was isolated from the skin and northern blots were hybridized sequentially with cDNA probes for cyclin D1, VEGF and GAPDH (loading control). Quantitation of the intensities of the bands were determined by densitometry and the ratios of cyclin D1 and VEGF to GAPDH are shown above each lane. D. A schematic drawing showing the signal transduction pathways mediating PGE2-induced primary keratinocyte proliferation. See the text for details.

References

    1. Fischer SM. Eicosanoids and tumor promotion. In: Muhktar H, editor. Skin Cancer: Mechanisms and Human Relevance. Boca Raton, FL: CRC Press; 1995. pp. 129–144.
    1. Fischer SM. Prostaglandins and cancer. Front Biosci. 1997;2:d482–d500. - PubMed
    1. Harris SG, Padilla J, Koumas L, Ray D, Phipps RP. Prostaglandins as modulators of immunity. Trends Immunol. 2002;23:144–150. - PubMed
    1. Flower RJ. Prostaglandins, bioassay and inflammation. Br J Pharmacol. 2006;147 Suppl 1:S182–S192. - PMC - PubMed
    1. Vane JR, Bakhle YS, Botting RM. Cyclooxygenases 1 and 2. Annu Rev Pharmacol Toxicol. 1998;38:97–120. - PubMed

Publication types

MeSH terms