

doi: 10.1038/nbt1418.
Epub 2008 Jun 22.
Induction of pluripotent stem cells by defined factors is greatly improved by small-molecule compounds
Affiliations
- PMID: 18568017
- PMCID: PMC6334647
- DOI: 10.1038/nbt1418
Item in Clipboard
Induction of pluripotent stem cells by defined factors is greatly improved by small-molecule compounds
Nat Biotechnol.
2008 Jul.
Abstract
Reprogramming of mouse and human somatic cells can be achieved by ectopic expression of transcription factors, but with low efficiencies. We report that DNA methyltransferase and histone deacetylase (HDAC) inhibitors improve reprogramming efficiency. In particular, valproic acid (VPA), an HDAC inhibitor, improves reprogramming efficiency by more than 100-fold, using Oct4-GFP as a reporter. VPA also enables efficient induction of pluripotent stem cells without introduction of the oncogene c-Myc.
Figures
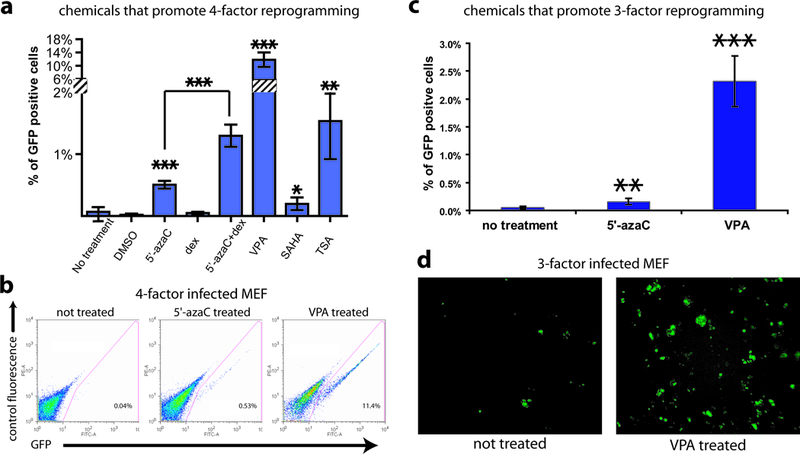
(a) The percentages of GFP+ cells induced in 4-factor (Oct4, Sox2, Klf4 and c-Myc) infected Oct4-GFP/+ MEFs treated with chemicals. Chemical treatments were: 5’-azaC (2 μM), dexamethasone (dex, 1 μM), 5’-azaC and dexamethasone, VPA (2 mM), SAHA (5 μM) and TSA (20 nM). The controls were infected MEFs without chemical treatment or treated with DMSO (the solvent for dexamethasone, SAHA and TSA). The y axis is truncated to accommodate the high percentage from the VPA treatment. For all figures in this study, standard deviations are indicated by error bars, and P values by two-tailed student t-test smaller than 0.05, 0.01 and 0.001 are indicated by one, two and three asterisks respectively. (b) Representative FACS plots from 4-factor infected MEFs treated with 5’-azaC and VPA compared to the control infected MEFs without treatment. (c) MEFs infected with the 3 factors (Oct4, Sox2, Klf4, but not c-Myc) were treated with 5’-azaC or VPA for a week and the percentage of Oct4-GFP+ cells induced was measured by FACS analysis at 10 days post-infection, and compared to 3-factor infected MEFs without chemical treatment. (d) Representative pictures at 16 days post-infection in 3-factor infected MEFs with VPA treatment compared to the control infected MEFs without VPA treatment.
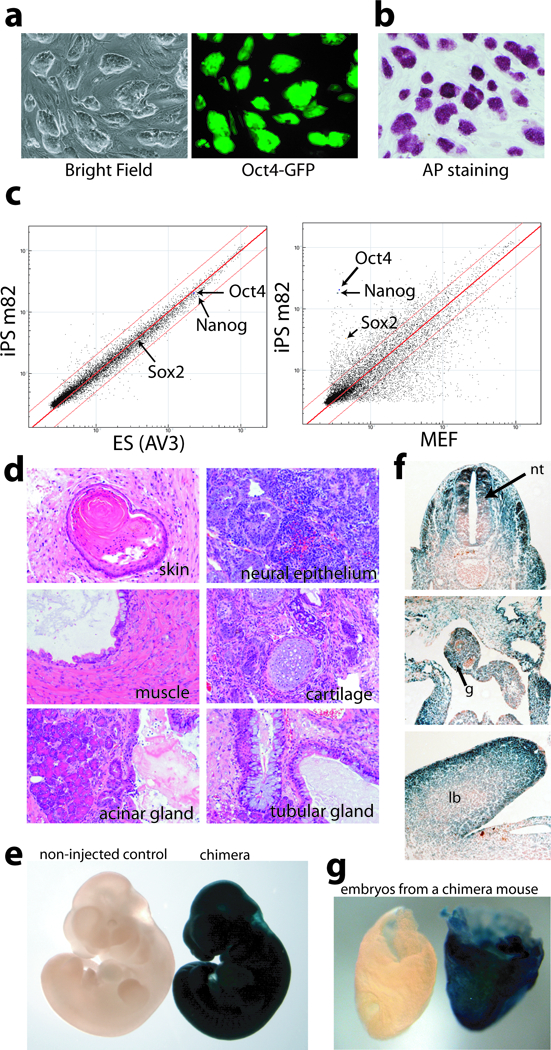
(a) iPS colonies exhibited typical ES cell morphology and expressed Oct4-GFP homogeneously. (b) iPS colonies exhibited high alkaline phosphatase activities. (c) Scatter plots comparing global gene expression patterns between iPS cells and ES cells, and iPS cells and MEFs. Red lines indicate the linear equivalent and two fold changes in gene expression levels between the samples. (d) Hematoxylin and eosin staining of teratoma sections showed differentiation of iPS cells to various tissues. (e) lacZ staining of a midgestation chimeric embryo from donor iPS cells carrying the Rosa26-lacZ allele, compared to the non-injected control. (f) Sections of chimeric embryos showed contribution of donor iPS cells to tissues derived from all three germ layers, including the neural tube (nt, ectoderm derivative), gut endoderm (g) and limb bud (lb, mesoderm derivative). (g) Shown here is a lacZ positive e8.5 embryo with a littermate control on the left from a mating between a wild type female and a chimera from blastocyst injection of iPS cells. Both embryos have yolk sacs attached, and are oriented with the anterior to the left.
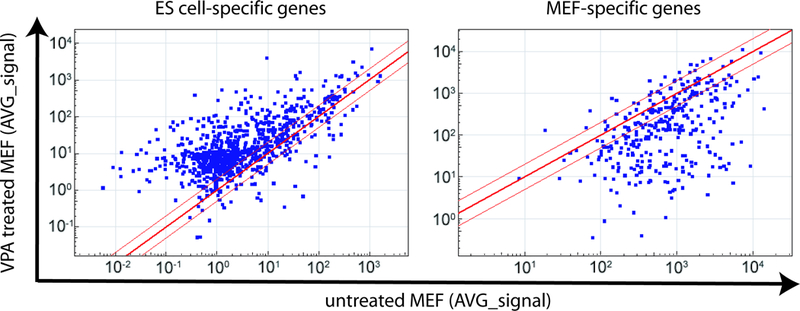
Microarray data were obtained from ES cells, iPS cells, untreated MEFs and MEFs treated with VPA. Genes that were specifically expressed in ES cells and MEFs (>10 fold difference) were selected, and scatter plots were generated to visualize the effect of VPA treatment on the expression of these genes. Red lines indicate the linear equivalent and two fold changes in gene expression levels.
References
Publication types
MeSH terms
Substances
Grants and funding
LinkOut - more resources
Full Text Sources
Other Literature Sources
Medical
