. 2008 Jul;11(7):807-15.
doi: 10.1038/nn.2145. Epub 2008 Jun 22.

Rapid and modifiable neurotransmitter receptor dynamics at a neuronal synapse in vivo

Affiliations

Rapid and modifiable neurotransmitter receptor dynamics at a neuronal synapse in vivo

Corey M McCann et al. Nat Neurosci. 2008 Jul.

Abstract

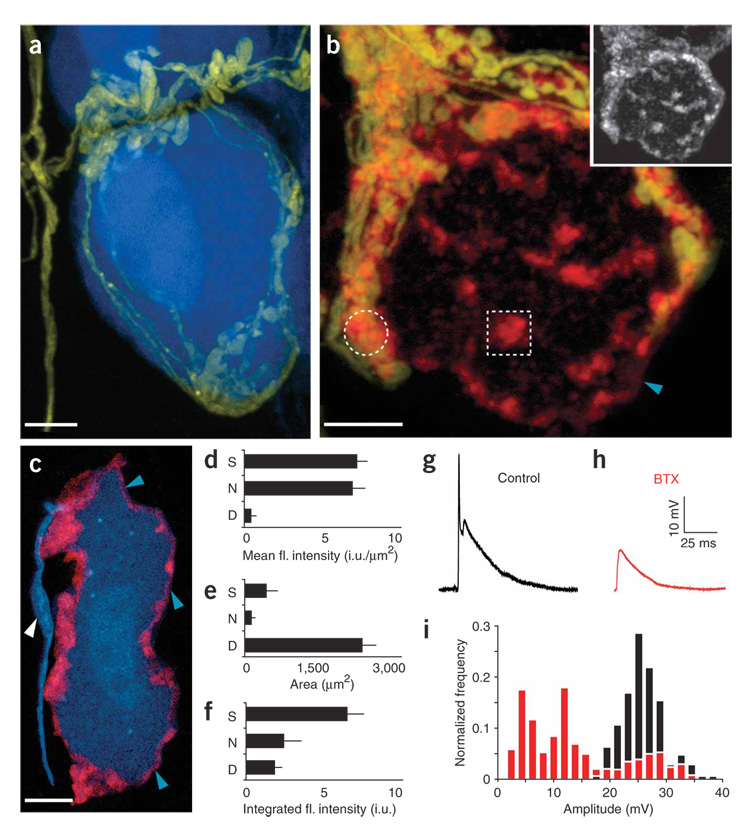
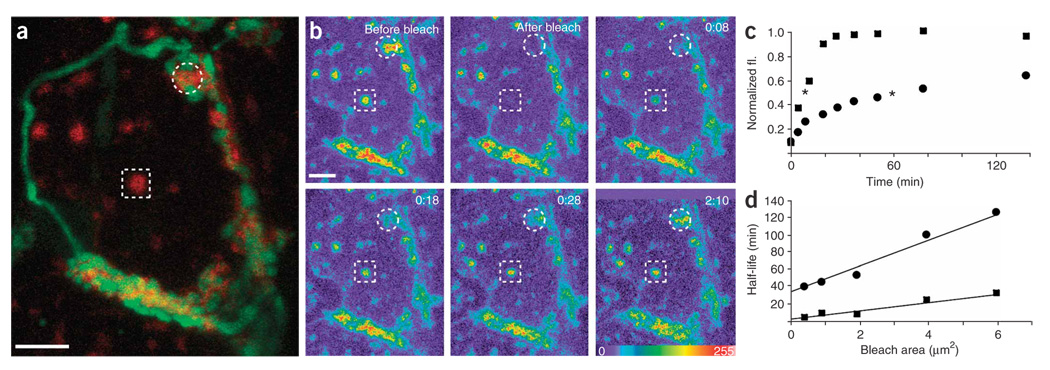
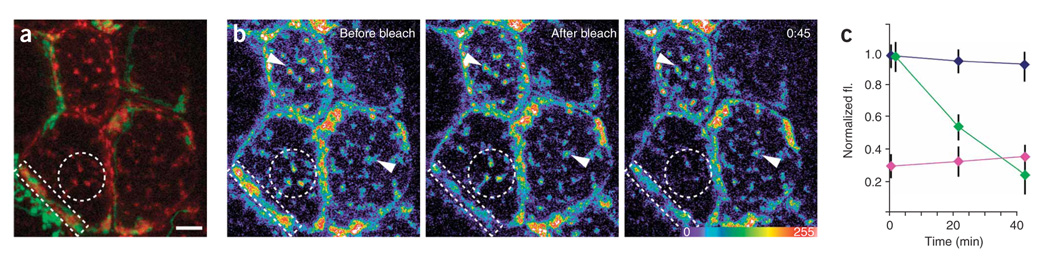
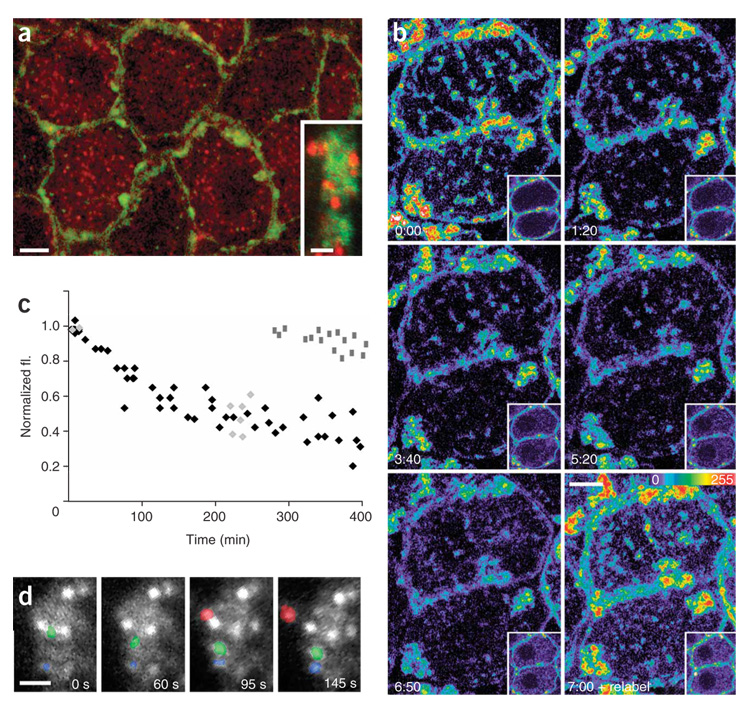
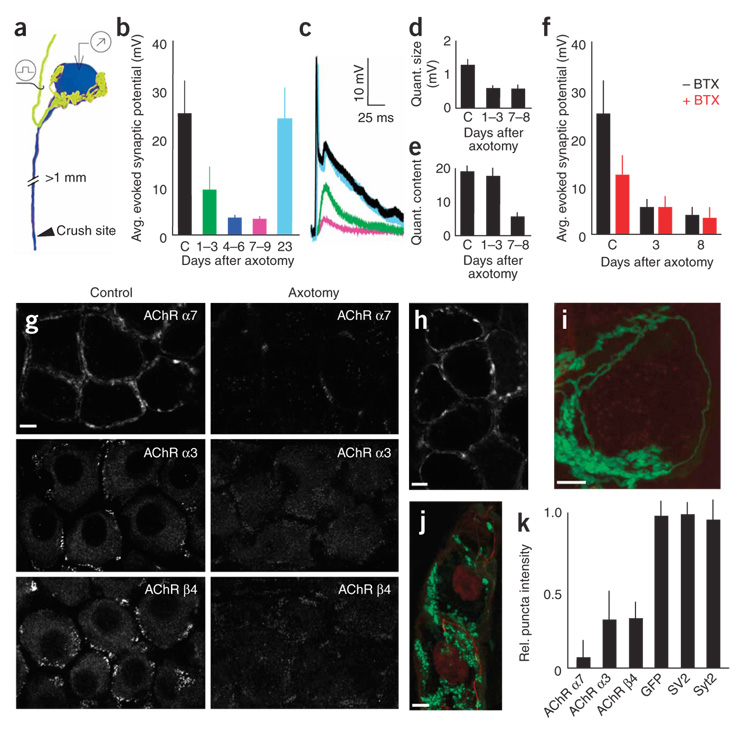
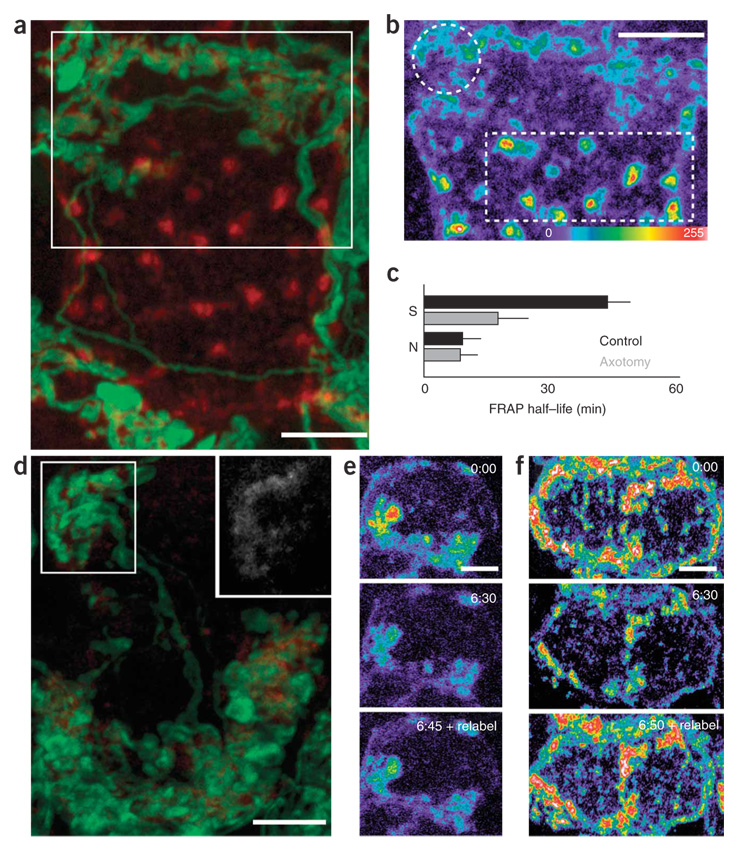
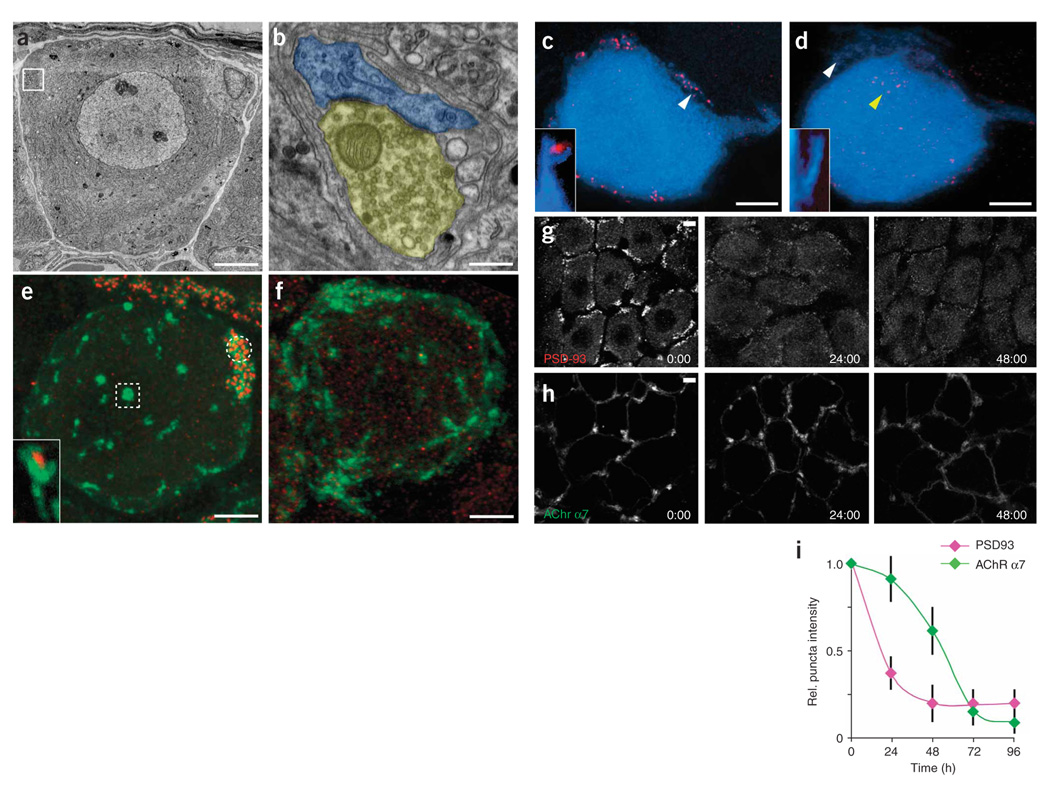
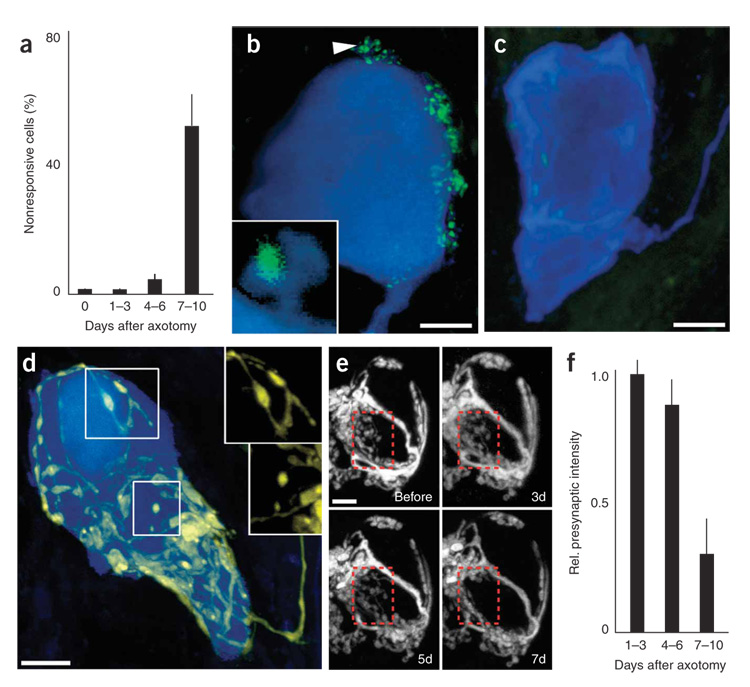
Synaptic plasticity underlies the adaptability of the mammalian brain, but has been difficult to study in living animals. Here we imaged the synapses between pre- and postganglionic neurons in the mouse submandibular ganglion in vivo, focusing on the mechanisms that maintain and regulate neurotransmitter receptor density at postsynaptic sites. Normally, synaptic receptor densities were maintained by rapid exchange of receptors with nonsynaptic regions (over minutes) and by continual turnover of cell surface receptors (over hours). However, after ganglion cell axons were crushed, synaptic receptors showed greater lateral mobility and there was a precipitous decline in insertion. These changes led to near-complete loss of synaptic receptors and synaptic depression. Disappearance of postsynaptic spines and presynaptic terminals followed this acute synaptic depression. Therefore, neurotransmitter receptor dynamism associated with rapid changes in synaptic efficacy precedes long-lasting structural changes in synaptic connectivity.


Figures

Figure 1
Figure 1. Fluorescently conjugated BTX binds to AChRs on postganglionic neurons in the mouse SMG
(a) Basket-like innervation of a single postganglionic neuron from a double transgenic mouse expressing YFP in preganglionic neurons (yellow) and CFP in postganglionic neurons (blue). (b) BTX (red) labels the surface of postganglionic neurons in a patchy pattern (inset). Only some BTX-labeled clusters are associated with preganglionic axon terminals (yellow; for example, compare circle and square). Unclustered receptors are also diffusely present (for example, blue arrowhead). (c) BTX (blue arrowheads) does not label the axon beyond the initial segment (white arrowhead). Scale bars, 5 µm. (d–f) Proportion of BTX-labeled AChRs in synaptic (S), nonsynaptic (N) and diffuse (D) AChR pools. Error bars, s.e.m. fl., fluorescence. i.u., intensity units. d shows the mean intensity of BTX-positive sites in the three receptor populations, e the area of each receptor population and f the total fluorescence associated with each of the three AChR pools. (g) Evoked suprathreshold synaptic potential from stimulation of preganglionic input to a postganglionic neuron. (h) The amplitude of evoked synaptic potentials was typically reduced below threshold by BTX application. (i) Histogram of evoked synaptic potential amplitudes pooled from multiple, randomly selected cells in control adult SMGs (black bars) and after addition of a saturating dose of BTX (red bars).
Figure 2
Figure 2. Lateral mobility of AChRs in synaptic and nonsynaptic clusters
(a) Similarly sized regions of synaptic (circle) and nonsynaptic (square) AChRs were photobleached (preganglionic axon, green; AChRs, red). (b) Time-lapse images of AChR labeling (intensity pseudocolored) before and after bleaching (hr:min). (c) Nonsynaptic receptor fluorescence recovered faster than synaptic AChRs. Asterisks indicate half-time of recovery. fl., fluorescence. (d) The half-life of recovery was slower for synaptic regions (circles) than for nonsynaptic regions (squares). Scale bars, 5 µm.
Figure 3
Figure 3. Mixing of synaptic and nonsynaptic AChRs
(a) Shown are AChRs sites that are synaptic (associated with green axons) and nonsynaptic (red only). (b) After bleaching of synaptic AChRs (rectangle), nonsynaptic AChRs on the same cell (circle) lost fluorescence more rapidly than nonsynaptic AChRs on neighboring cells (arrows) suggesting that bleached synaptic receptors moved into nonsynaptic regions of the same cell. (c) Quantification of the experiment shown in b. Green diamonds represent nonsynaptic AChR fluorescence (fl.) on the bleached cell, and blue diamonds represent nonsynaptic AChR intensity on neighboring cells. Purple diamonds represent synaptic AChR fluorescence in the bleached region. Error bars, s.e.m. Scale bar, 5 µm.
Figure 4
Figure 4. Turnover of cell surface AChRs
(a) Evidence for substantial internalization (red) and replenishment (green) of cell surface receptors over 12 h by fluorescent pulse-chase labeling of cell surface AChRs (see text for details). Inset, imaging single synaptic AChR clusters showed that, in and near the sites of new AChRs (green), old AChRs (red) were visible as small round puncta. (b) Time-lapse imaging of BTX-labeled AChRs shows progressive dimming of cell surface receptors (first five panels, time 0:00 through 6:50) while intracellular fluorescence steadily increased (see corresponding insets). Cells were relabeled with BTX to highlight newly inserted AChRs. Cell surface labeling returned to the original intensity (last panel, time 7:00 + relabel), indicating that rates of insertion and removal of AChR were similar. (c) Quantification of the decay of cell surface BTX labeling from 60 ganglion cells in 14 animals. Each data point represents the pooled fluorescence for a single cell compared to its intensity at time 0. Black diamonds represent data collected continuously (as in b) and light gray diamonds represent experiments where the animal was allowed to recover in between images. Dark gray rectangles represent AChRs immediately after relabeling. (d) Time-lapse of an AChR cluster 12 h after BTX labeling, showing rapidly moving (green), stable (blue) and budding (red) puncta (see also Supplementary Movie 1). Scale bars, 5 µm in a–c, 2 µm in inset of a and in d.
Figure 5
Figure 5. Postsynaptic AChR loss underlies axotomy-induced synaptic depression
(a) Schematic depicting the assay for the effects of postganglionic nerve crush on pre- to postganglionic connections (yellow, preganglionic axon; blue: postganglionic neuron). (b–f) Physiological analysis of axotomized SMG neurons (c shows control values from normal cells). The amplitudes of evoked synaptic potentials were rapidly reduced after axotomy in the SMG (b). Also shown are sample traces from control and axotomized neurons (c); colors correspond to those of the datasets shown in b. Quantal size was reduced soon after axotomy (d), whereas quantal content was reduced later (e). (f) BTX blocked synaptic transmission in control cells (by ~50%) but had no effect on cells that had been axotomized 3–8 d before. (g) 72 h after nerve crushing, AChR α7 (BTX) and α3 and β4 AChR subunits (antibodies) were significantly reduced. (h) Three weeks after axotomy, synaptic transmission recovered and AChR α7 labeling was again visible. (i) 72 h after nerve crush, GFP-labeled preganglionic axons (green) formed normal-appearing basket-like inputs to axotomized ganglion cells even after BTX-labeled AChRs (red) were no longer present. (j) The presynaptic marker synaptotagmin-2 (green) and the axonal marker neurofilament (red) remained in preganglionic axon terminals 72 h after postganglionic axotomy. Scale bars, 5 µm in all images. (k) At 72 h, presynaptic markers were unaffected by axotomy, but postsynaptic AChRs were significantly reduced. The intensity of synaptic puncta staining in axotomy was compared to controls to give a relative measure. Error bars, s.e.m.
Figure 6
Figure 6. Altered distribution and dynamism of surface AChRs associated with AChR loss after axotomy
(a) Confocal reconstruction of the surface AChRs (red) and nerve terminal (green) of a ganglion cell 24 h after axotomy. (b) AChRs (red in a), pseudocolored, from the boxed region in a. Synaptic AChRs (circle) appear dimmer than nonsynaptic AChR clusters (square). (c) Pooled data from multiple experiments depicting the half-time of FRAP recovery for synaptic AChRs (S) and nonsynaptic AChRs (N) for control cells (black bars) versus cells 24 h after axotomy (gray bars). Error bars, s.e.m. (d) Confocal stack of a postganglionic neuron 48 h after axotomy. Dim BTX labeling (red) can still be found apposed to presynaptic terminals (green). Inset, enhanced image of BTX labeling from the boxed region in the upper left position of d shows remaining AChRs. (e) Time-lapse imaging of BTX-labeled AChRs 36 h after axotomy shows disequilibrium between removal and insertion of AChRs. (f) Fluorescence decay and relabeling intensity in a control ganglion cell. In control (f) and axotomized cells (e), surface labeling grew dim over the course of hours (compare the first images at time 0 to the second images taken 6 h 30 min later). However, after axotomy, relabeling of newly inserted AChRs produced only a small increase in receptor fluorescence (see 6:45 + relabel), whereas fluorescence intensity recovered to initial levels in control cells (see 6:50 + relabel). Scale bars, 5 µm in all images.
Figure 7
Figure 7. Loss of PSD-93 from postsynaptic spines precedes axotomy induced AChR loss
(a) Electron micrograph of a normal ganglion cell. Boxed region contains synaptic contacts. (b) High-magnification view of the boxed region in a (yellow, presynaptic terminal boutons; blue, postsynaptic spines). (c) In a control ganglion cell (blue), PSD-93 is localized to small spines that protrude from the cell surface (white arrow and inset). (d) By 36 h after axotomy, many spines no longer contained PSD-93 labeling (white arrow and inset) and cells now contained mislocalized PSD-93 puncta (yellow arrow). (e) In normal ganglion cells, PSD-93 (red) colocalized with synaptic AChR α7 (green labeling, circle) but was not found at nonsynaptic clusters of AChR α7 (box). Inset, both PSD-93 and AChR α7 were present on small spines that extend from the cell surface. (f) Thirty-six hours after axotomy, PSD-93 (red) was no longer associated with any AChR α7 clusters (green). (g) Loss of PSD-93 occurs rapidly after axotomy. Loss is apparent by 24 h and progresses until 48 h after axotomy. (h) Loss of AChR α7 occurred more slowly than loss of PSD-93. (i) Loss of AChR α7 surface labeling was preceded by loss of PSD-93. Error bars, s.e.m. Scale bars, 5 µm in a,c–h and 0.2 µm in b.
Figure 8
Figure 8. Delayed synapse elimination after postganglionic axotomy
(a) One week after postganglionic axotomy, about half of the postganglionic neurons no longer showed synaptic potentials in response to preganglionic stimulation. (b) Control postganglionic neurons (blue) possess small spines protruding from the cell surface (see arrow and inset). These spines colocalize with SV2, a marker for presynaptic terminals (green). (c) By 7 d after axotomy, postganglionic neurons showed few if any spines and presynaptic staining was no longer associated with the postsynaptic somata. (d) Preganglionic axon (yellow) that possessed retraction bulb–like structures (upper box) and disconnected axonal swellings (lower box) instead of the normal contiguous axonal wrapping. Insets, images of the preganglionic axons from the boxed regions in d. (e) Time-lapse imaging of preganglionic axons after postganglionic axotomy (enhanced to maximize contrast). By 7 d after axotomy, presynaptic terminals are lost (last image, red box). (f) Presynaptic fluorescence intensity was unchanged 1–3 d after axotomy, but was significantly reduced by 7–10 d after axotomy. Scale bars, 5 µm in all images. Error bars, s.e.m.

Similar articles

Cited by

References

    1. Malinow R, Malenka RC. AMPA receptor trafficking and synaptic plasticity. Annu. Rev. Neurosci. 2002;25:103–126. - PubMed
    1. Triller A, Choquet D. Surface trafficking of receptors between synaptic and extra-synaptic membranes: and yet they do move! Trends Neurosci. 2005;28:133–139. - PubMed
    1. Song I, Huganir RL. Regulation of AMPA receptors during synaptic plasticity. Trends Neurosci. 2002;25:578–588. - PubMed
    1. Borgdorff AJ, Choquet D. Regulation of AMPA receptor lateral movements. Nature. 2002;417:649–653. - PubMed
    1. Lu W, et al. Activation of synaptic NMDA receptors induces membrane insertion of new AMPA receptors and LTP in cultured hippocampal neurons. Neuron. 2001;29:243–254. - PubMed

Publication types

MeSH terms

Substances

LinkOut - more resources